
How to Review Spend Insights for Open RFx?
This section provides spend insights and dashboard analytics for all RFx currently in "Open" status. By reviewing these metrics prior to issuing a Purchase Order, you can better evaluate market dynamics and project accurate lead times for RFx closure.
Insights link to navigate to is: https://app.teradix.com/insights
- If you are not Admin, don't expect to see detailed company insights as follows.
Procurement users has access to user-level (personal) insights only.
Click Insights Tab
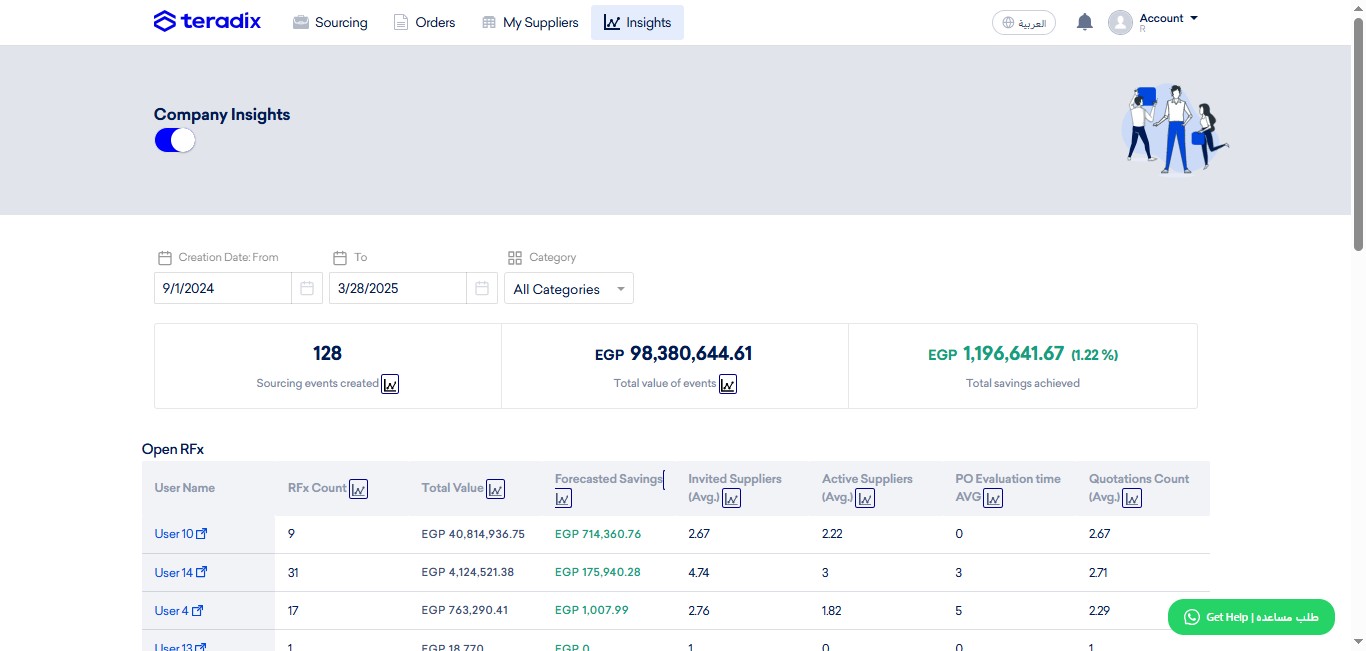
Using filters, specify the (from) date since when sourcing events created.
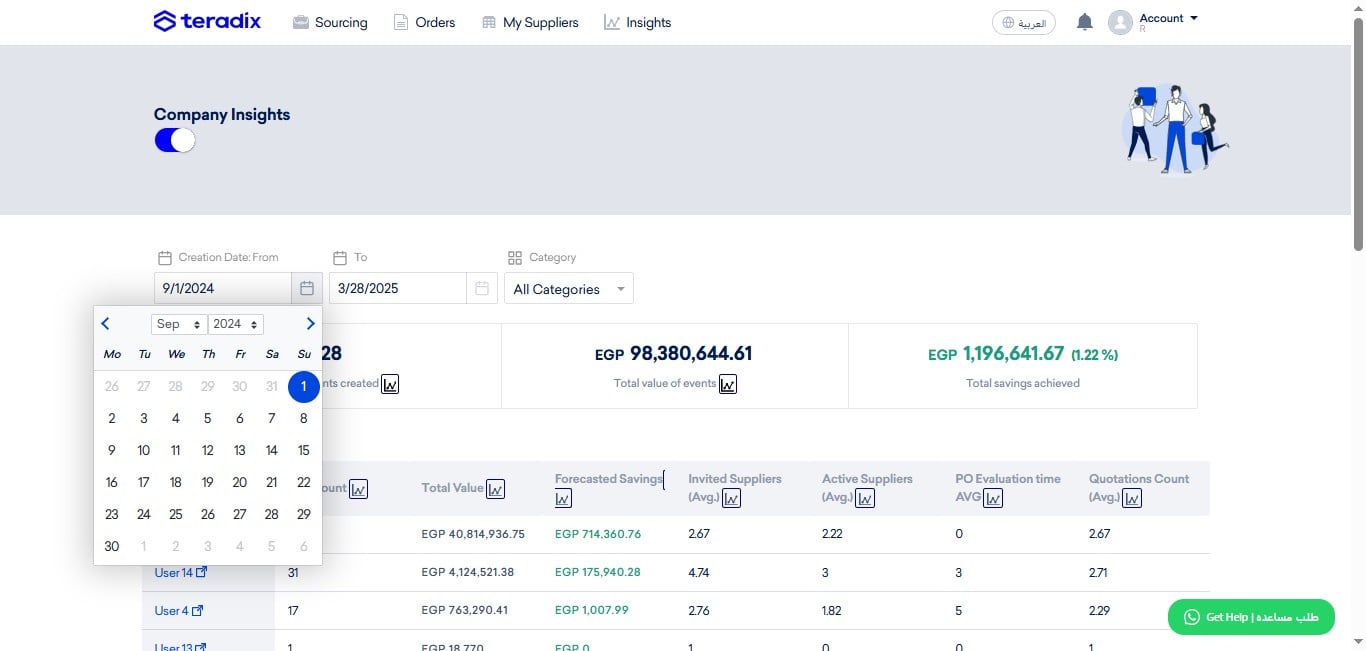
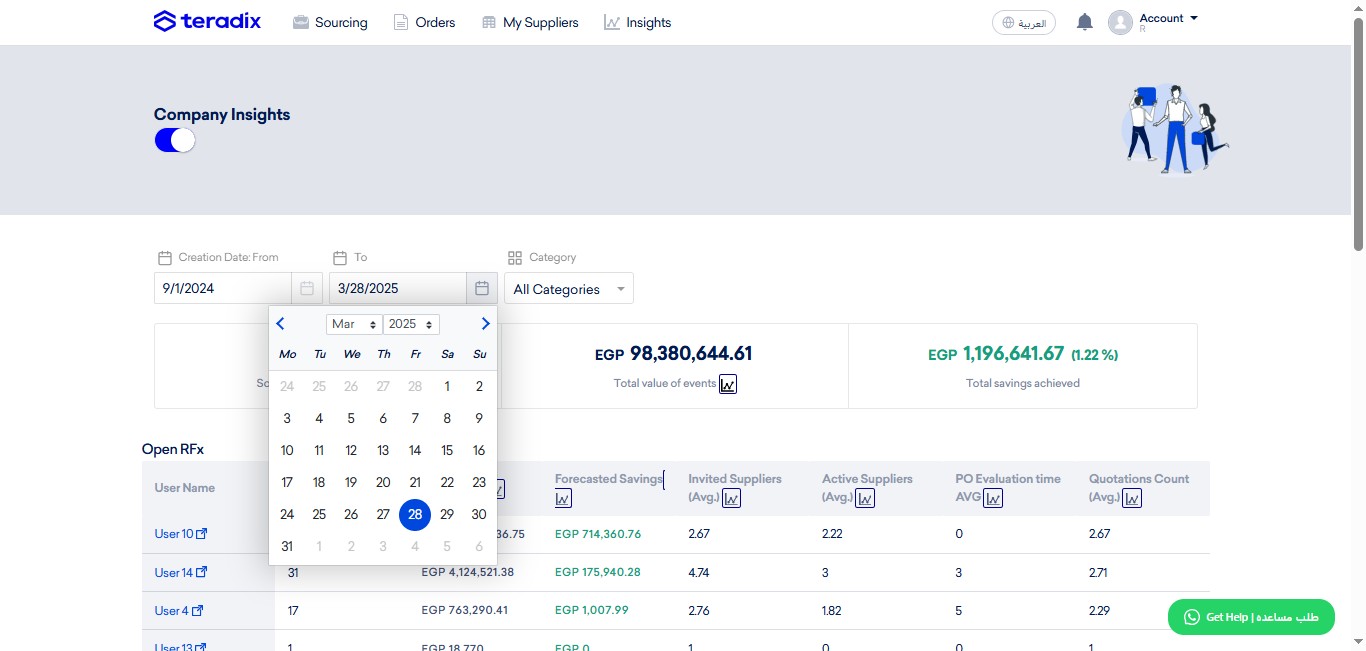
Specify the (to) date until which sourcing events where closed.
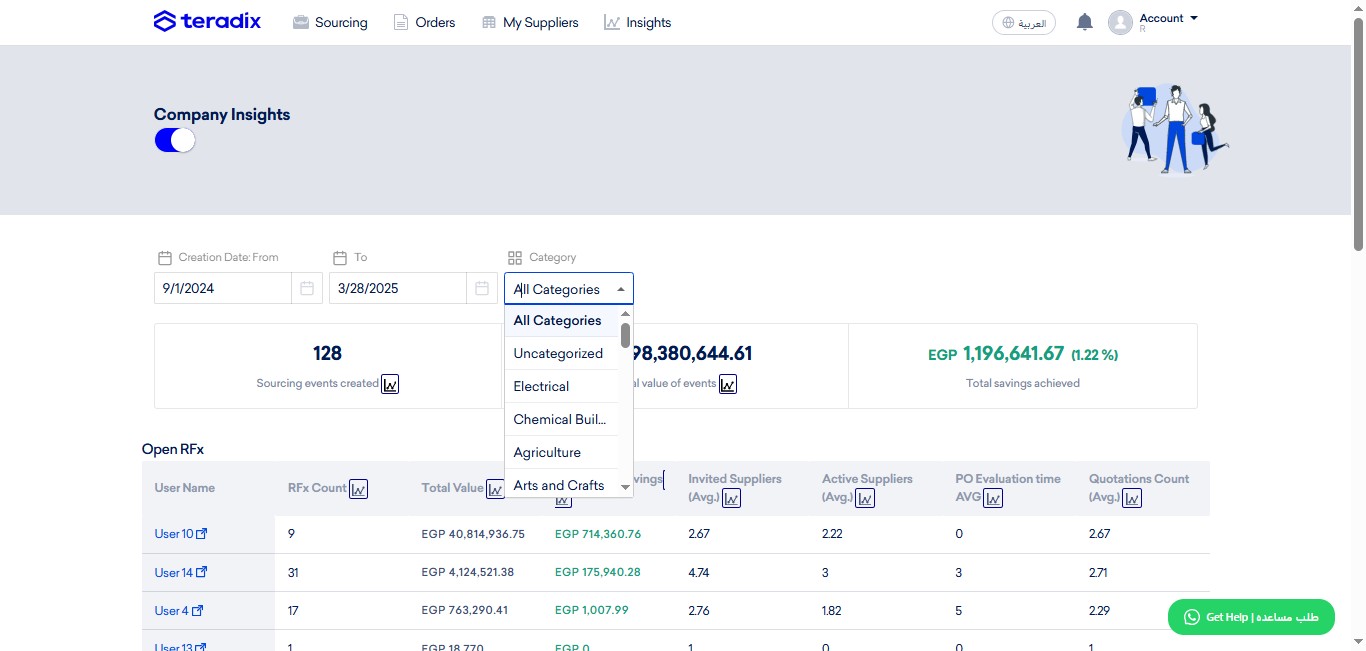
Specify the the category of sourcing events to audit (default is All Categories).
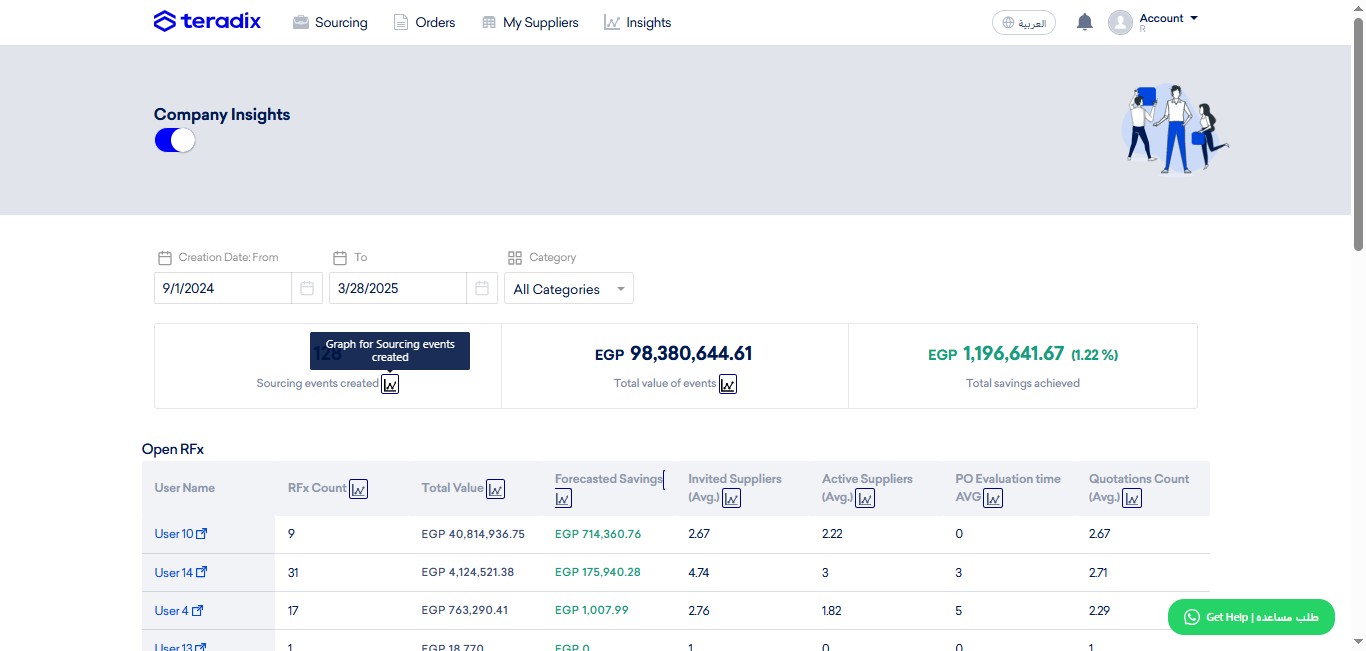
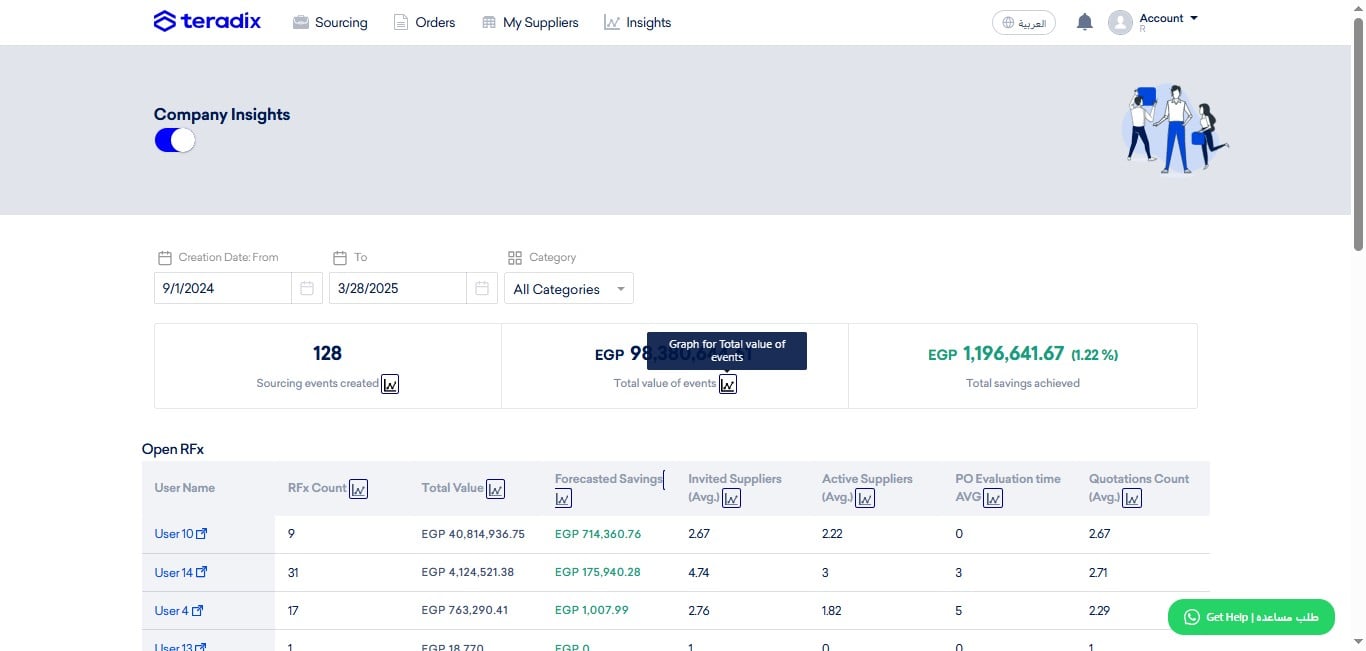
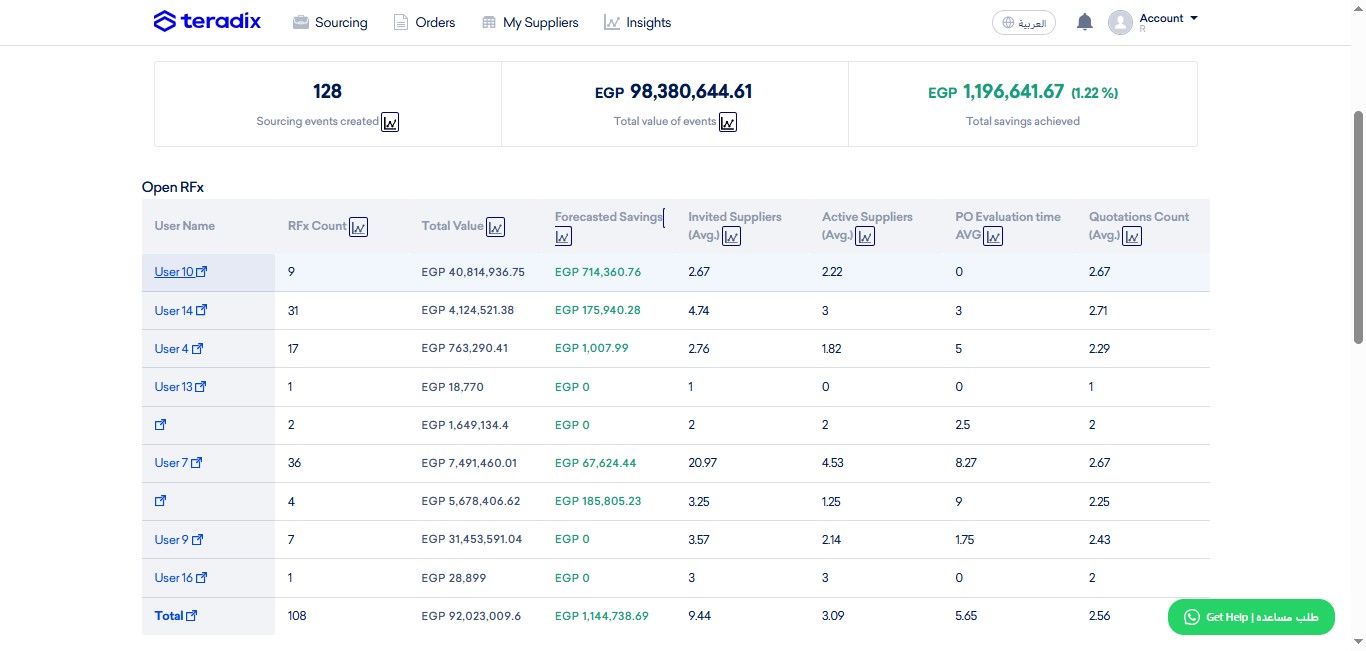
Sourcing Events Created; the number of sourcing events created within the filters specified.
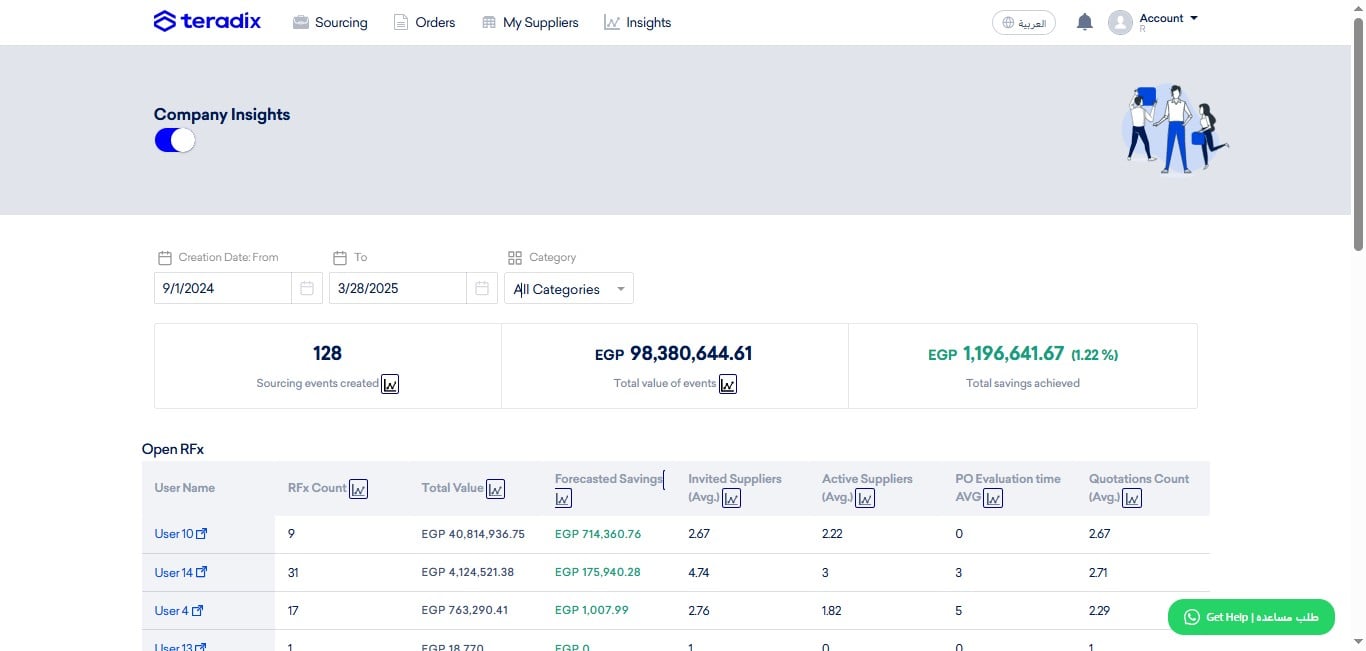
Click on this graph button to check the progress of Sourcing Events visually, as follows;
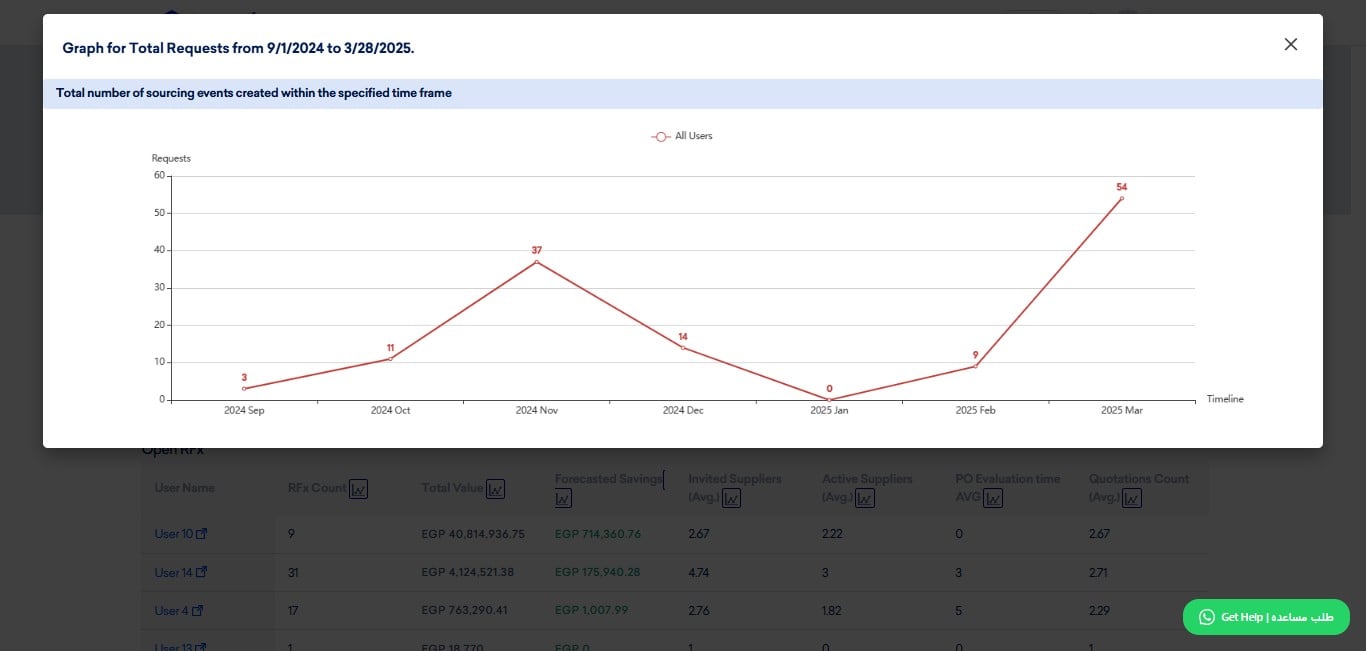
Visual Graph of Sourcing Events Creation, per filters specified.
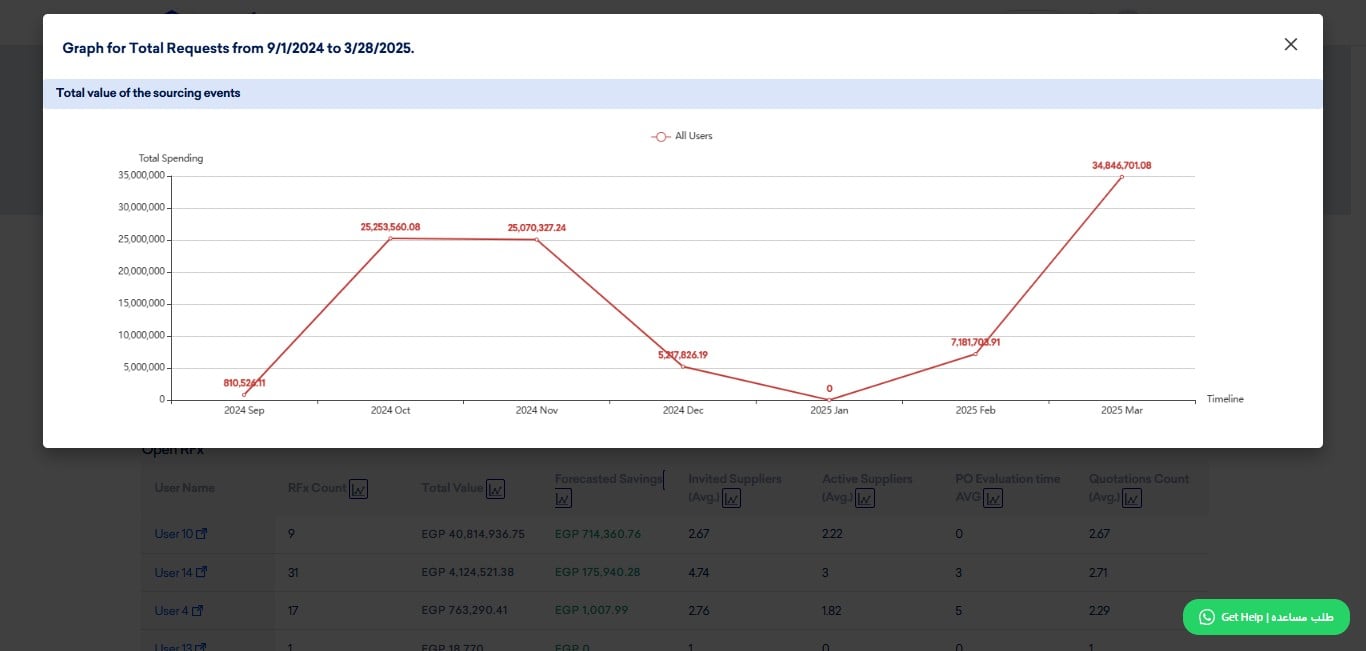
Total Value of Events: the whole worth spend of RFx (ongoing & closed), within filters applied.
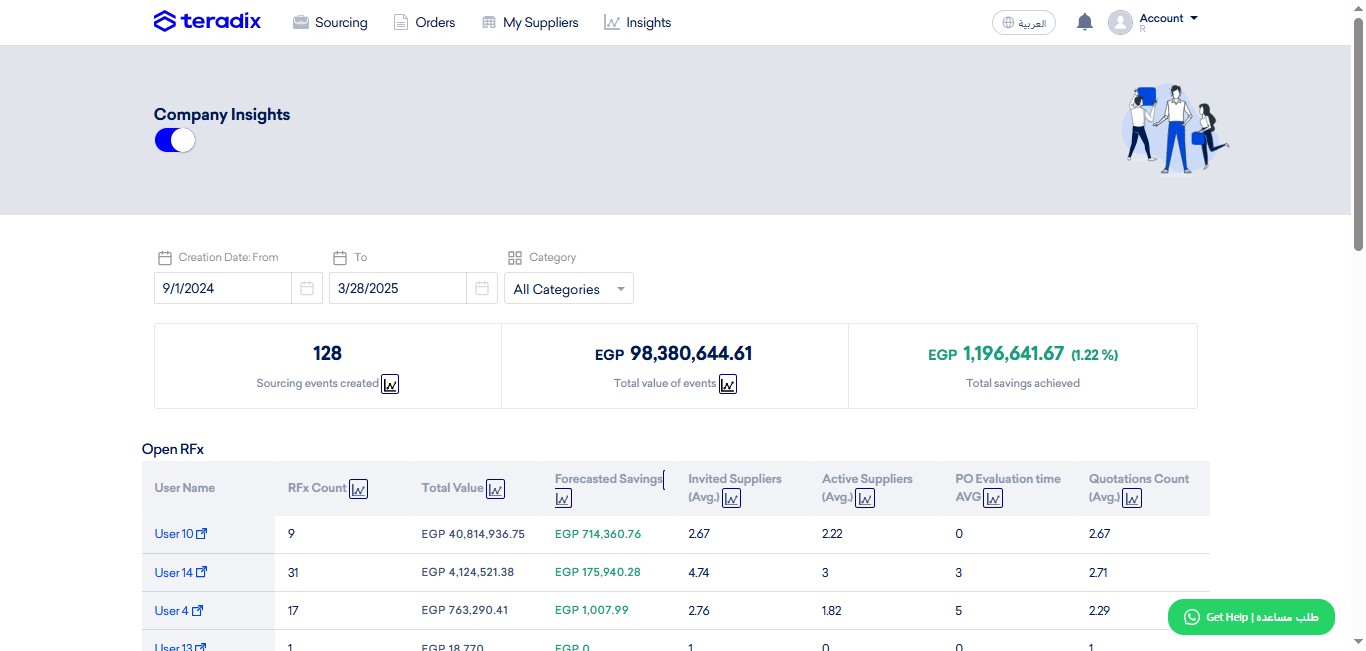
Click on this graph button to track the movement of spend visually, as follows;
Total Savings Acheived; Savings are coorelated with "Target Price";
- In case Target Price disabled, then savings acheived by awarding the lowest last price after negotation (cost reduction method).
- In case Target Price enabled, then savings acheived by awarding lowest price below Target Price specified.
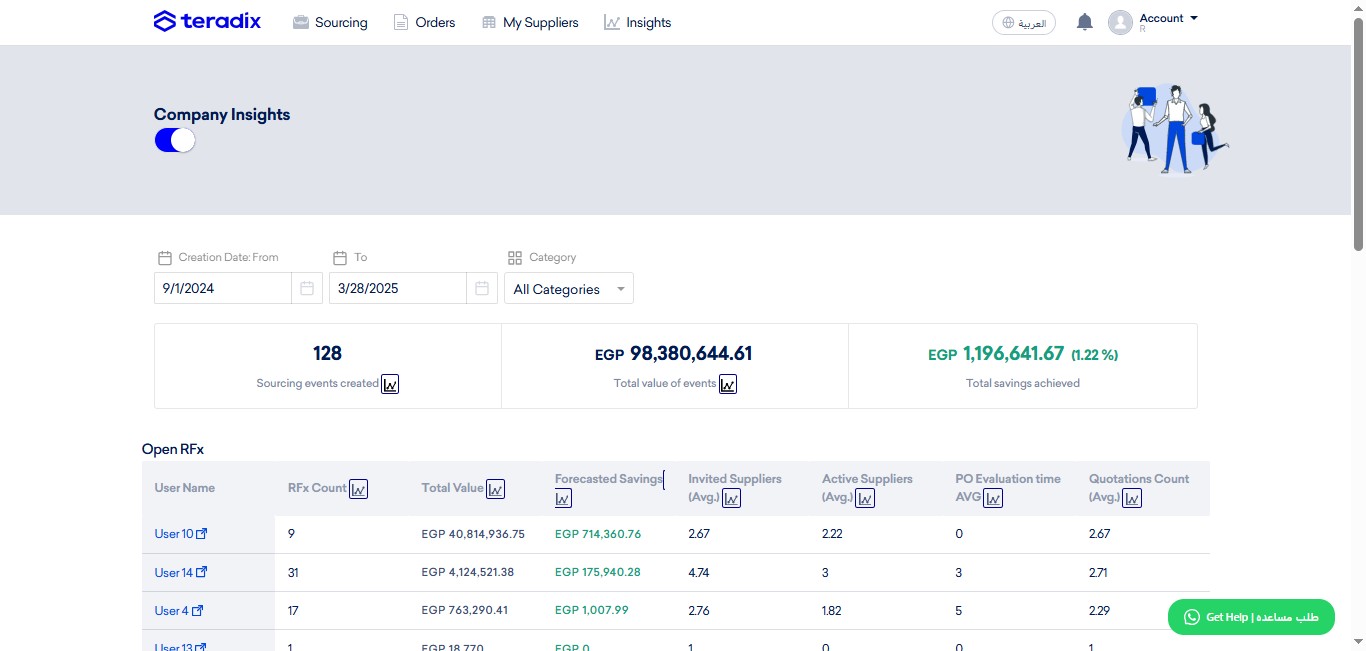
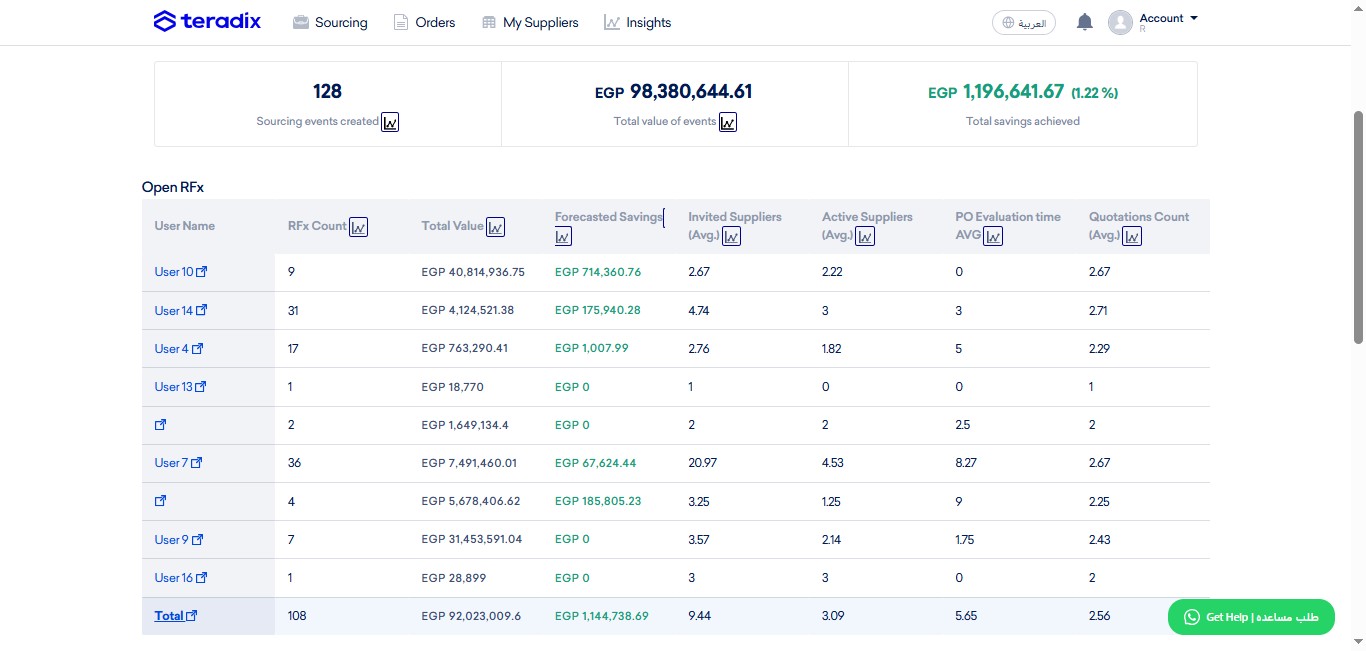
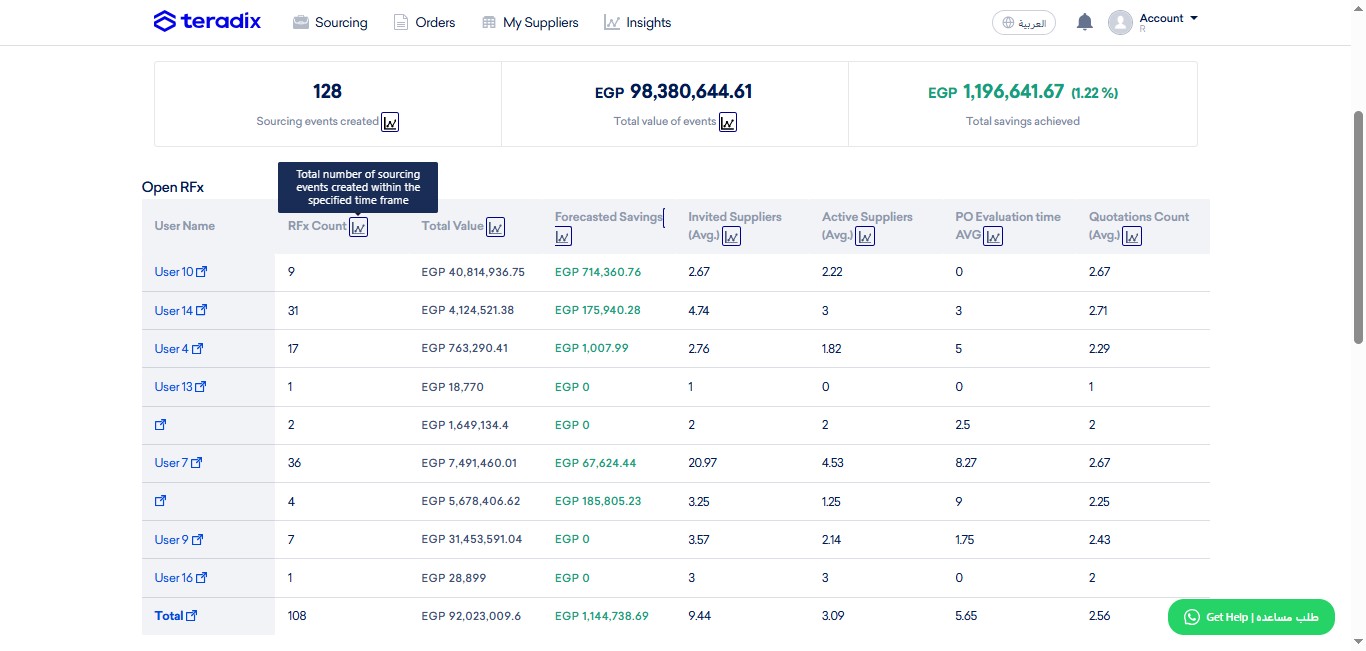
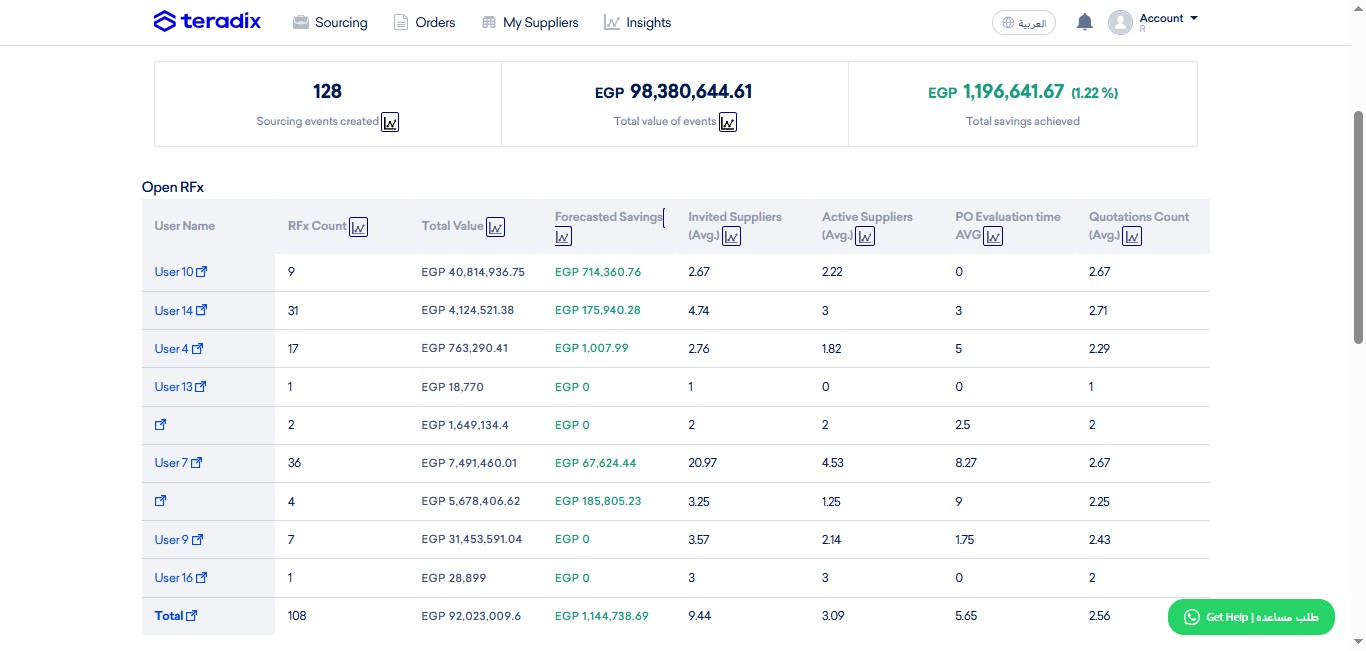
RFx are divided into two sections: - Open RFx: where to find only sourcing events that are unclosed yet (disregarding due date). - Closed RFx (below): where to find only sourcing events tht are closed (disregarding cancelled events).
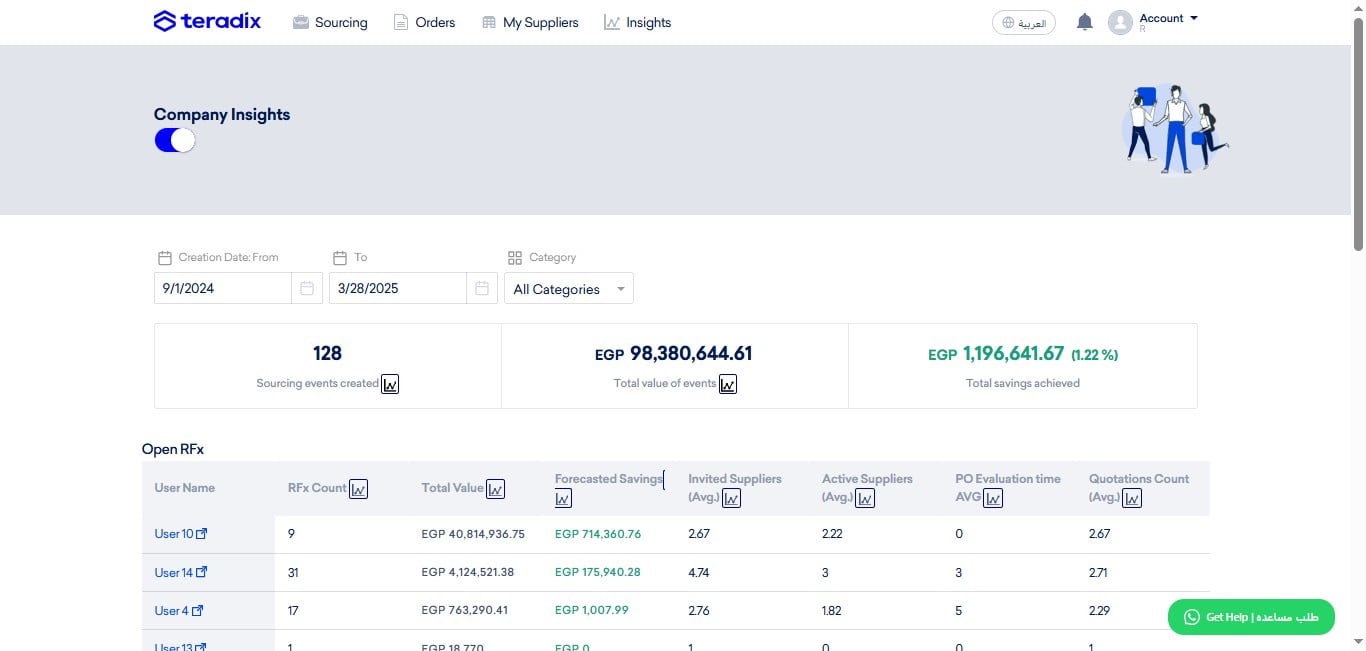
Click on User Name to check assigned (user-level) requests, that are open.
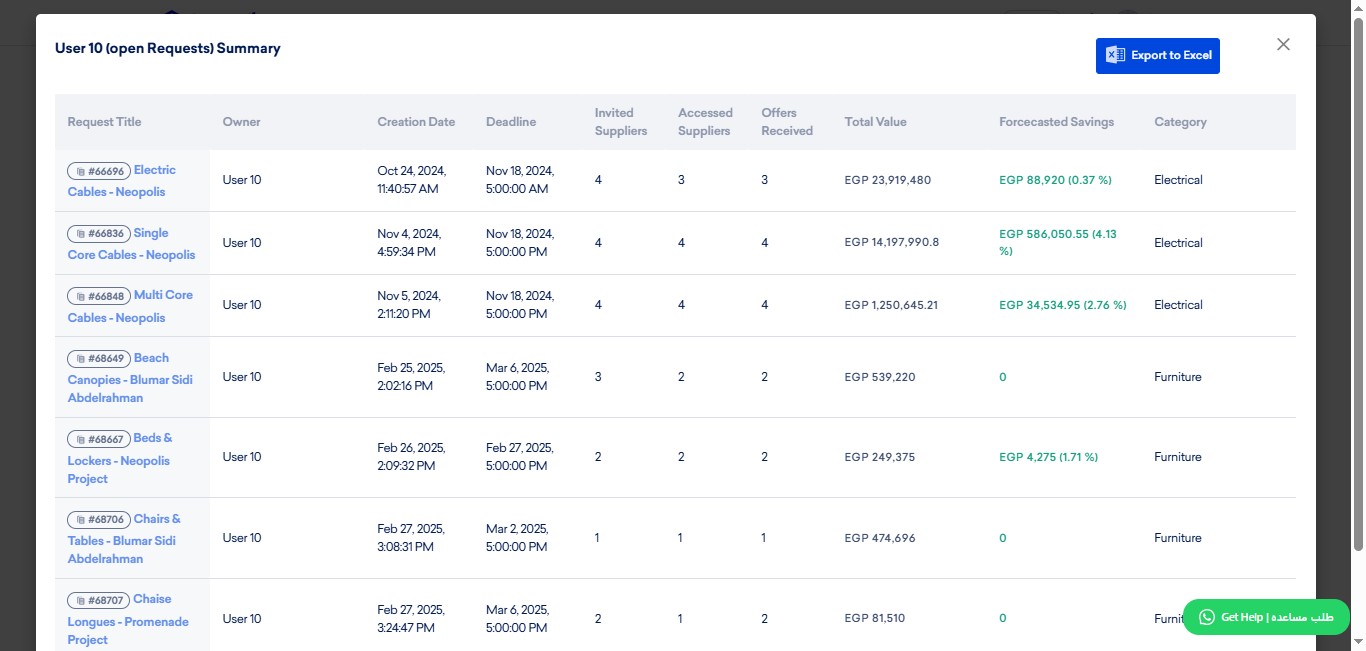
Request Title; a column of the requests opened, you can click on each to navigate into separately
Creation Date; when each request was created.
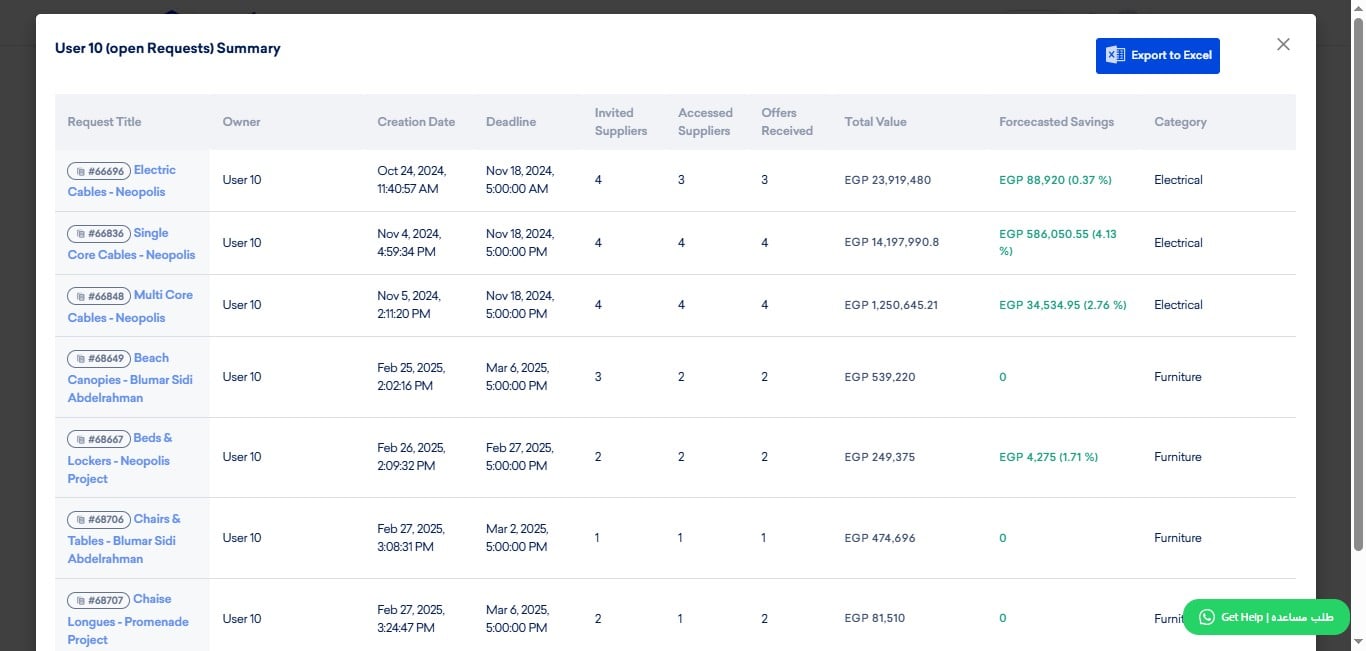
Deadline; when each request is due.
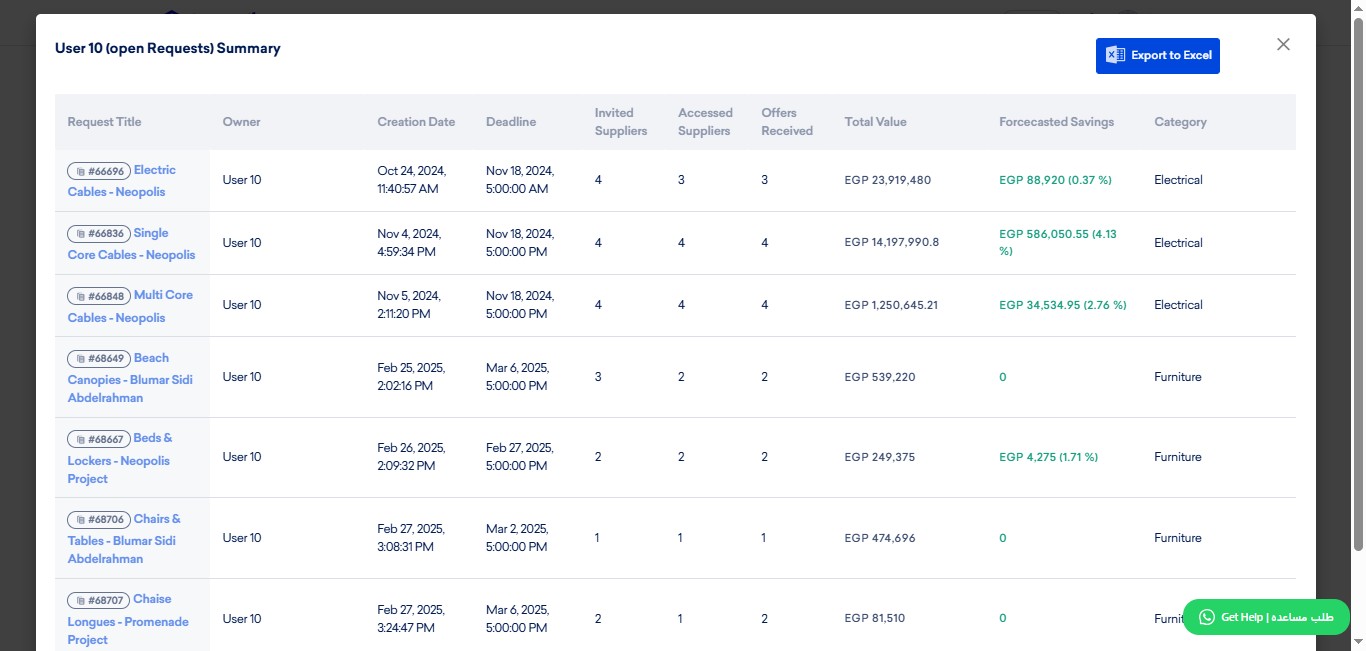
Invited Suppliers: Number of suppliers invited per request.
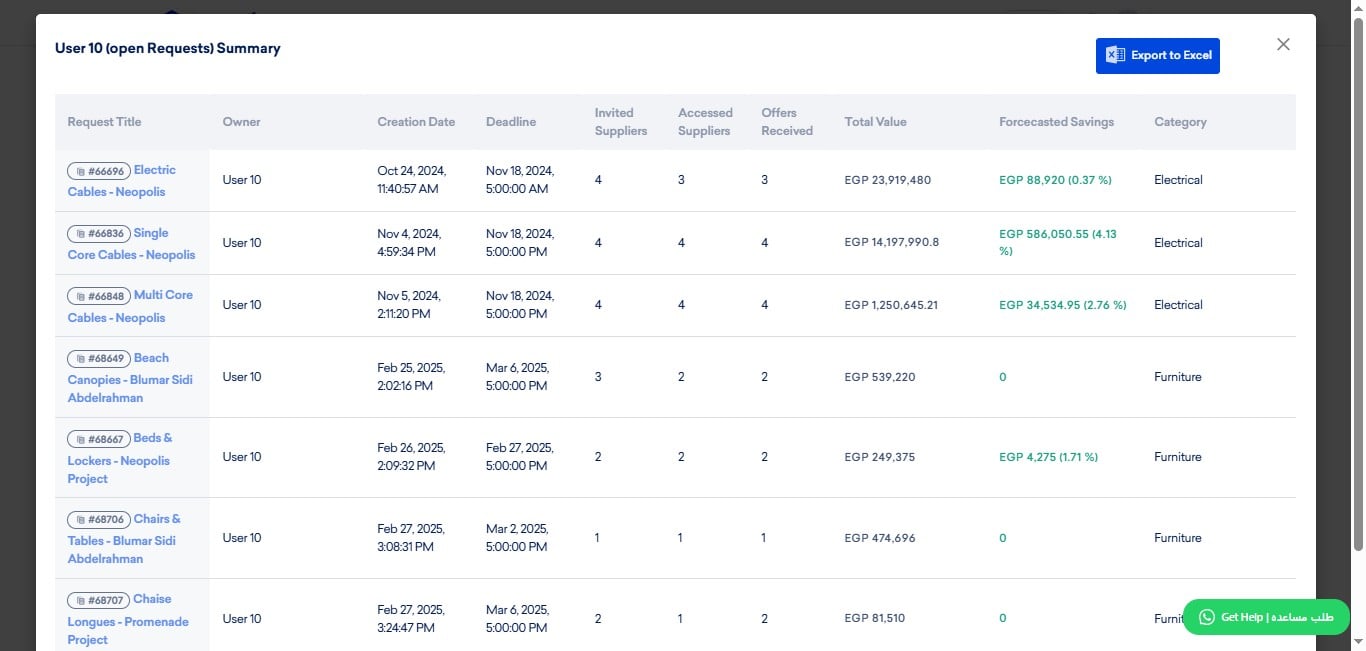
Accessed Suppliers: Number of suppliers accepted the request.
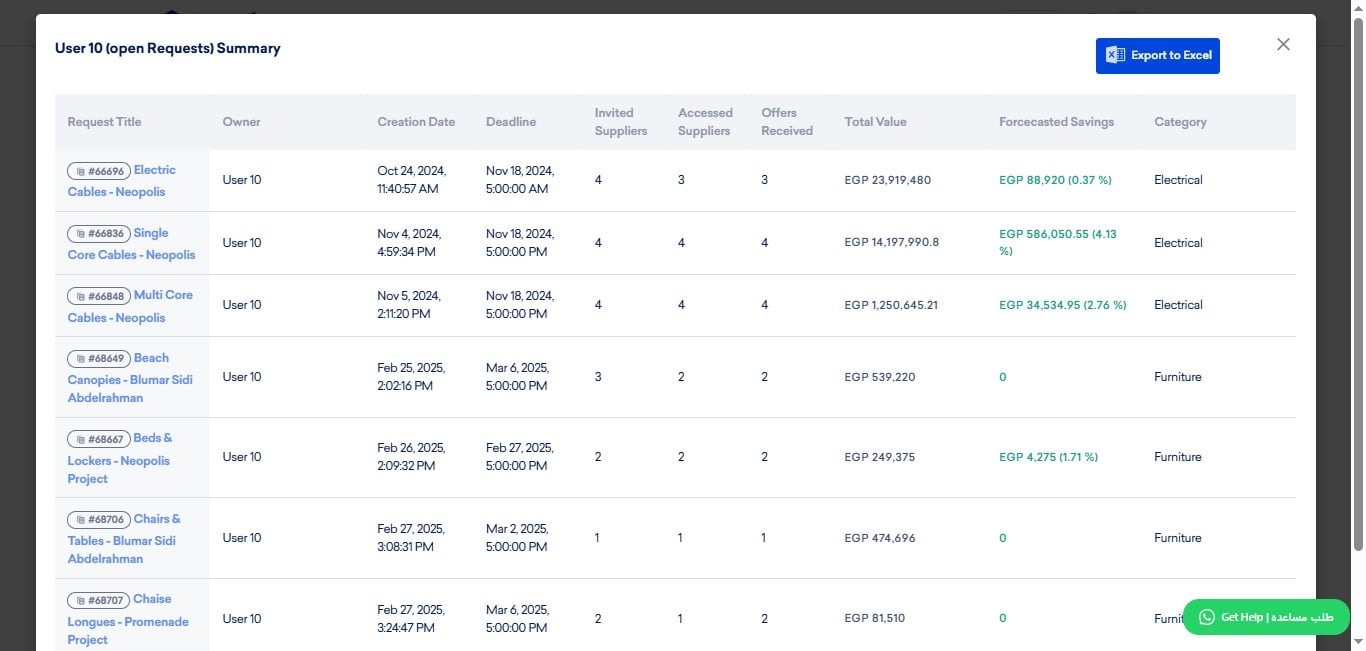
Offers Received: Number of offers received from suppliers accepted the Request.
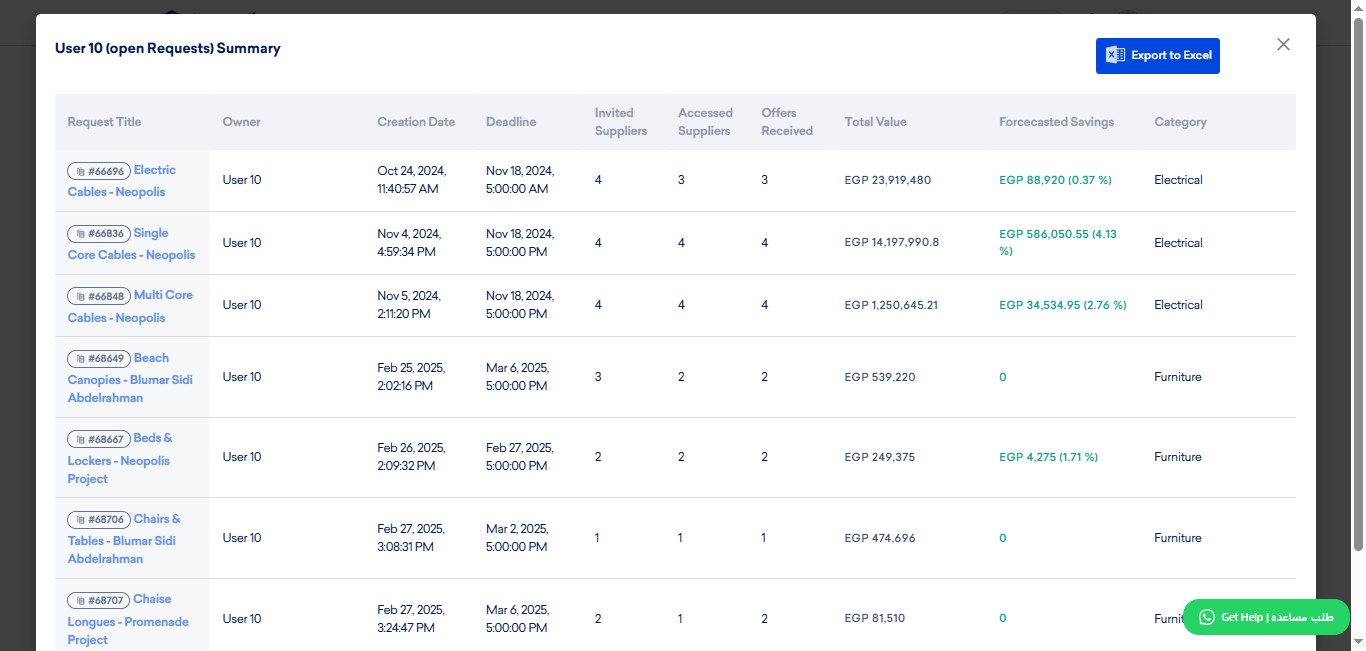
Total Value of the submitted offer
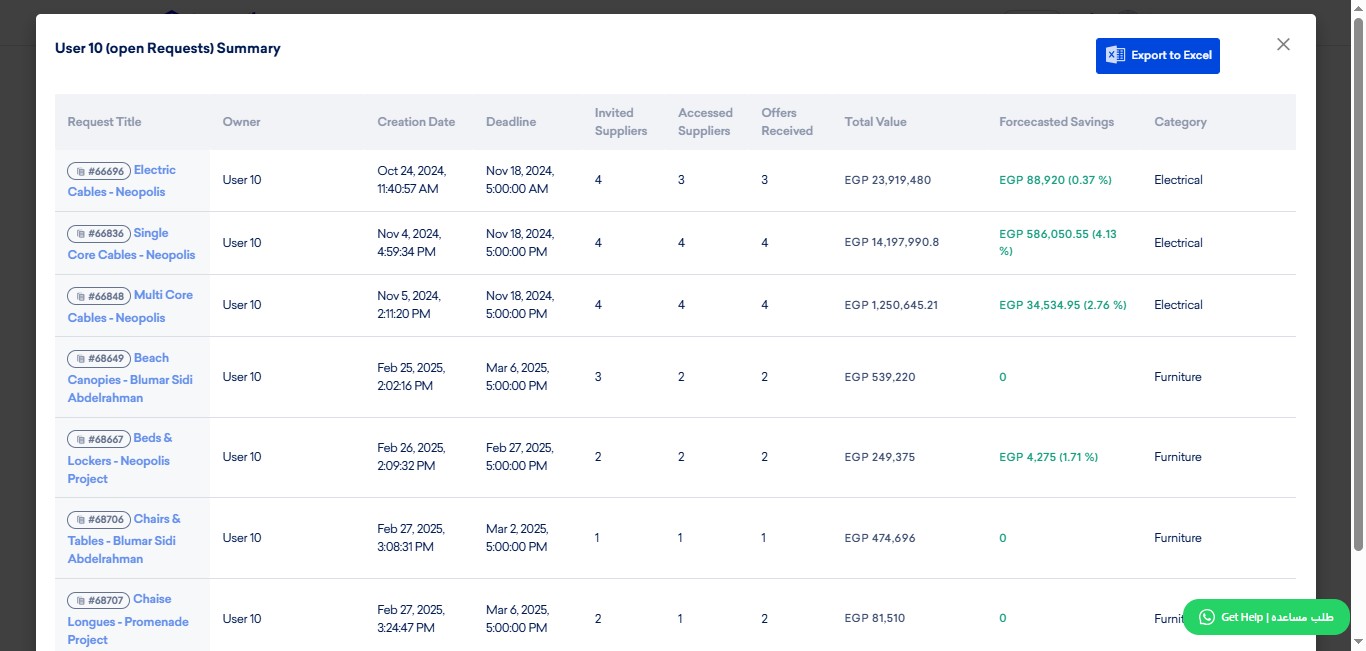
Forecasted Savings; Forecasted Savings are coorelated with "Target Price";
- In case Target Price disabled, then savings are forecasted by the potential of awarding the lowest last price after negotation (cost reduction method).
- In case Target Price enabled, then savings are forecasted by the potential of awarding lowest price below Target Price specified.
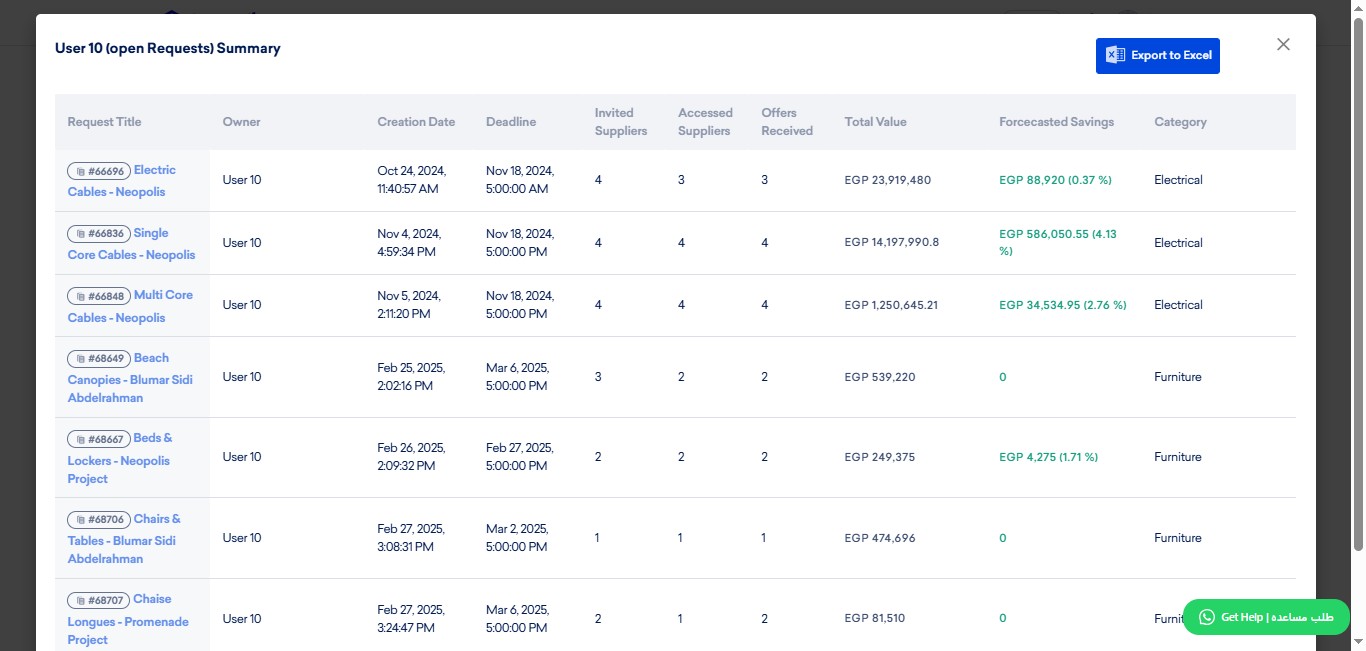
The category of each request.
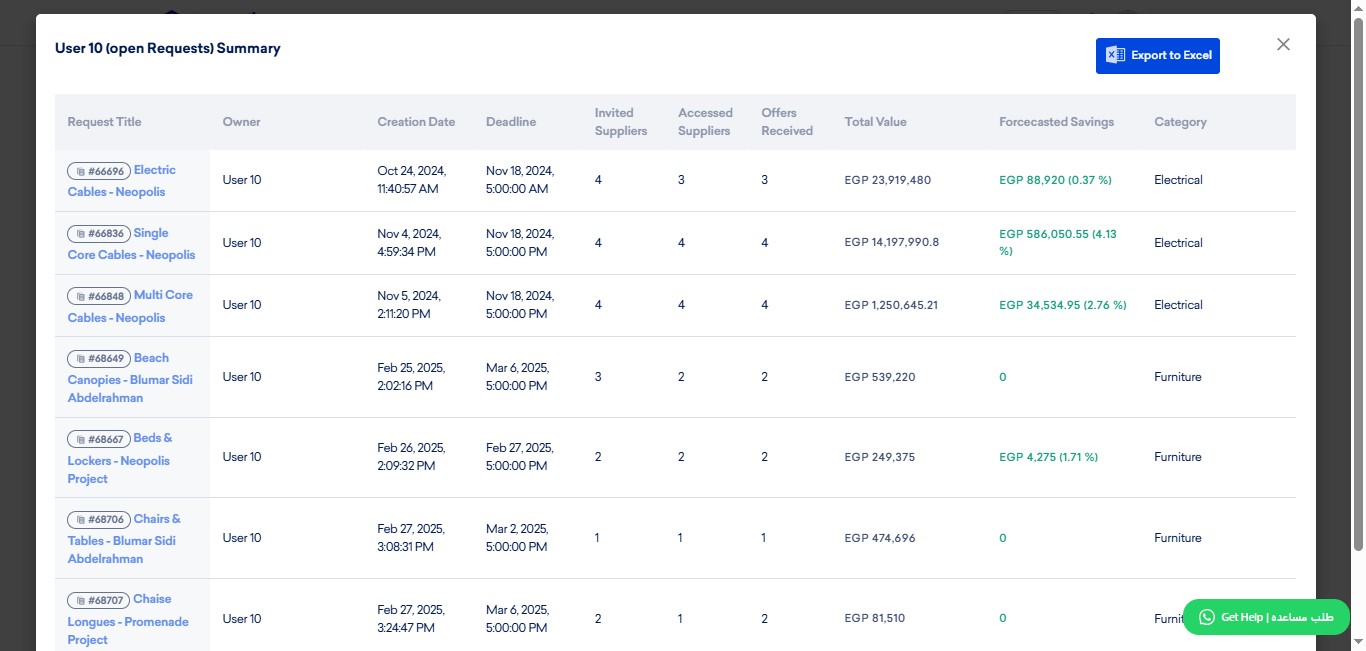
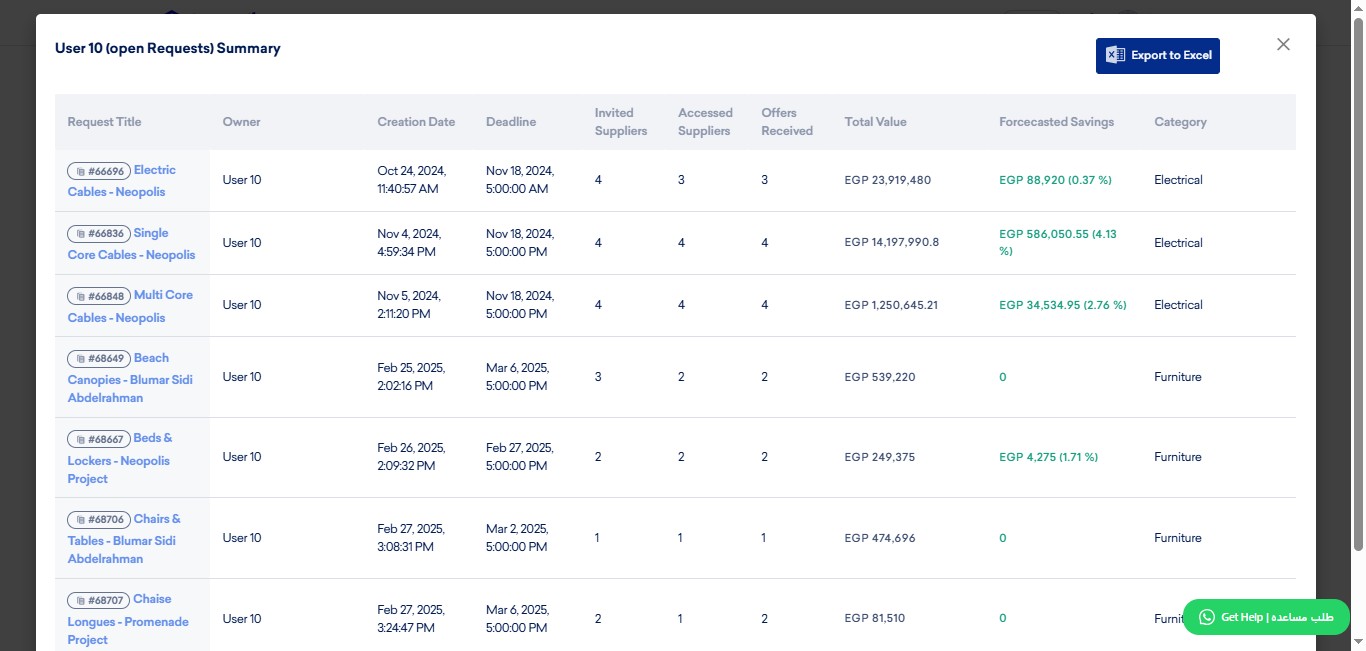
Click on "Export to Excel"; if you want to export all this data local, in order to customise and personalize your use of the data.
Click on "Total" to audit numbers of all users, in the scope of Open RFx.
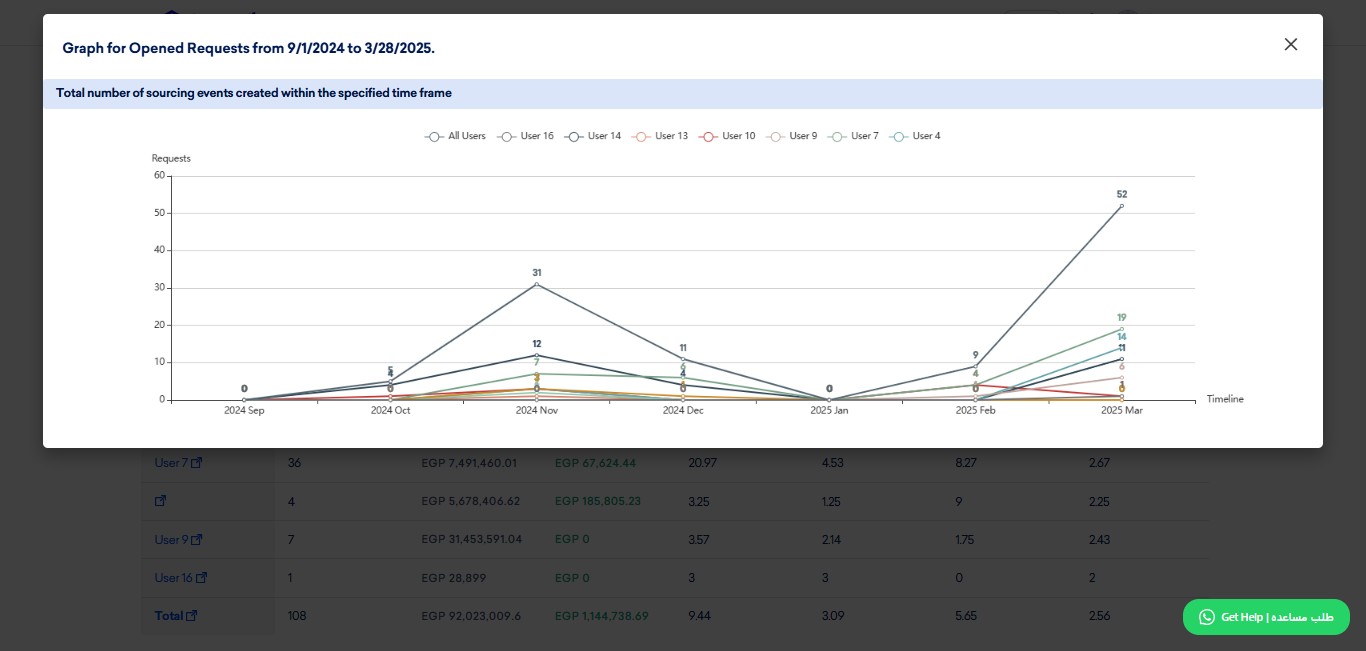
Click on this graph button o visually track the progress of request count per timerange, as follows.
You can benchmark and compare users' performance, by comparing all (by default), or clicking on a User Name to hide performance in Graph.
- Now you supposedly understand Open RFx section in Insights.
Frequently Asked Questions
- Who can see detailed company insights versus personal insights?
Only Admin users see detailed company insights. Procurement users have access to user-level (personal) insights only — if you are not an Admin, do not expect to see company-wide detail.
- How do I filter the data by date and category?
Use the filters: specify the (from) date when sourcing events were created and the (to) date until which sourcing events were closed. Also specify the category of sourcing events to audit (default is All Categories).
- What do “Total Savings Achieved” and “Forecasted Savings” mean and how are they calculated?
Both metrics are correlated with the Target Price setting: 1) If Target Price is disabled, savings achieved (and forecasted savings) are based on awarding the lowest last price after negotiation (cost reduction method). 2) If Target Price is enabled, savings achieved (and forecasted) are based on awarding the lowest price below the specified Target Price.
- What’s the difference between Open RFx and Closed RFx in Insights?
Open RFx shows sourcing events that are unclosed (disregarding due date). Closed RFx shows only sourcing events that are closed (disregarding cancelled events).
- How can I view details, visualize progress, compare users, and export the data?
Click a User Name to check assigned (user-level) open requests. Click a request title to navigate into that request. Use the graph buttons (near “Sourcing Events Created” and “Total Value of Events”) to view visual progress of events and spend. To benchmark users, view all by default in the graph or click a specific User Name to hide that user’s performance from the graph. To download the data for custom use, click “Export to Excel.” To audit totals across users in Open RFx, click “Total.”