
How to Review Closed RFx in insights
Navigate to https://app.teradix.com/insights
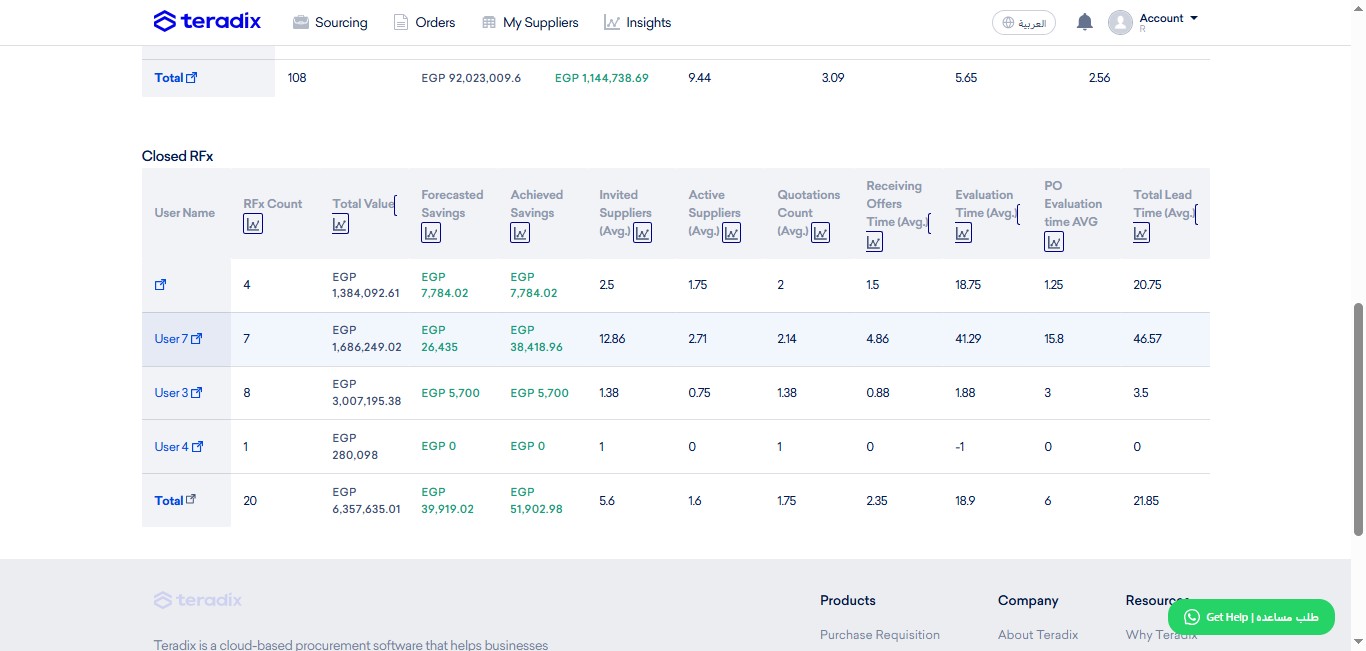
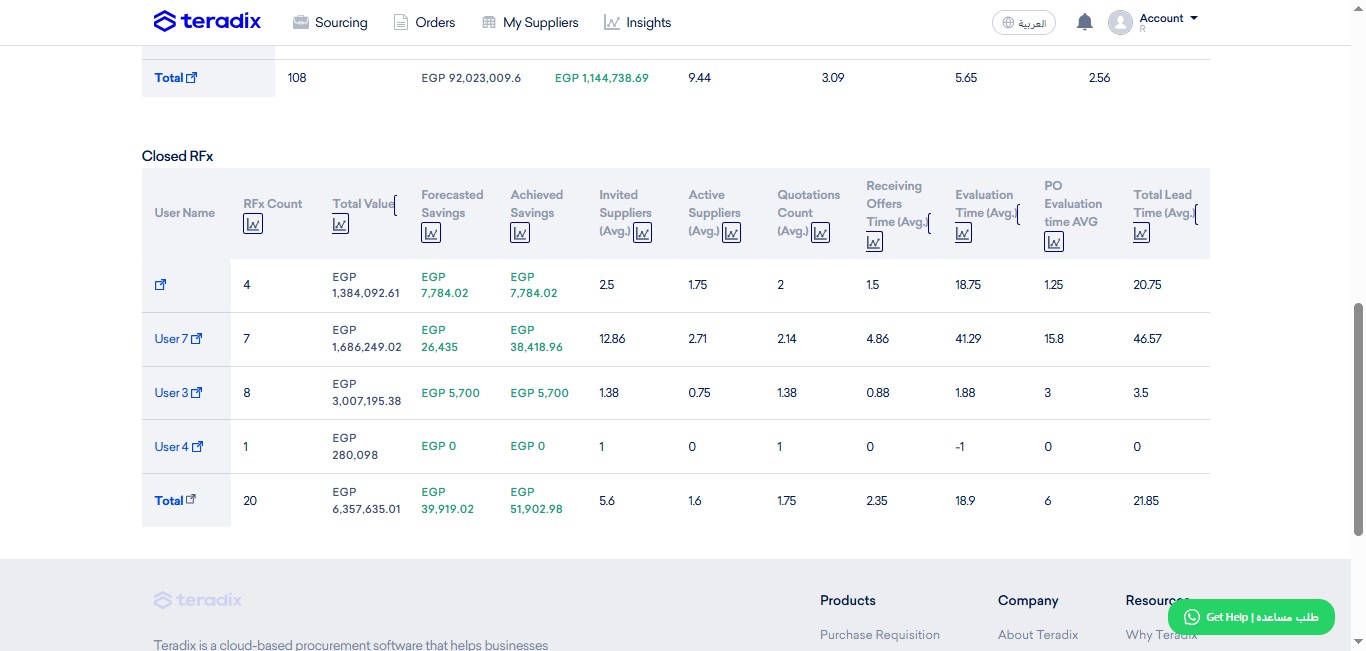
Find in the Closed RFx section more detailed indicators from closed sourcing events.
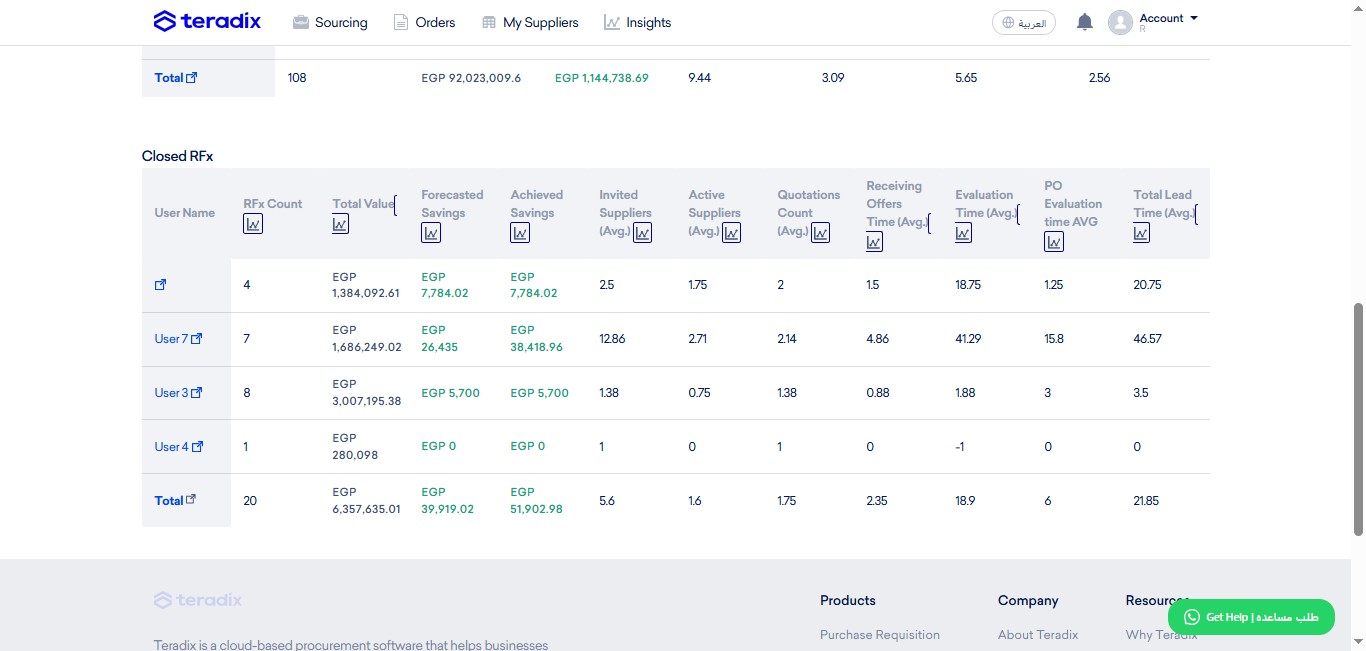
"RFx Count"; where to find the number of sourcing events closed per each user, to know the team workload distribution, limited by filter you applied above.
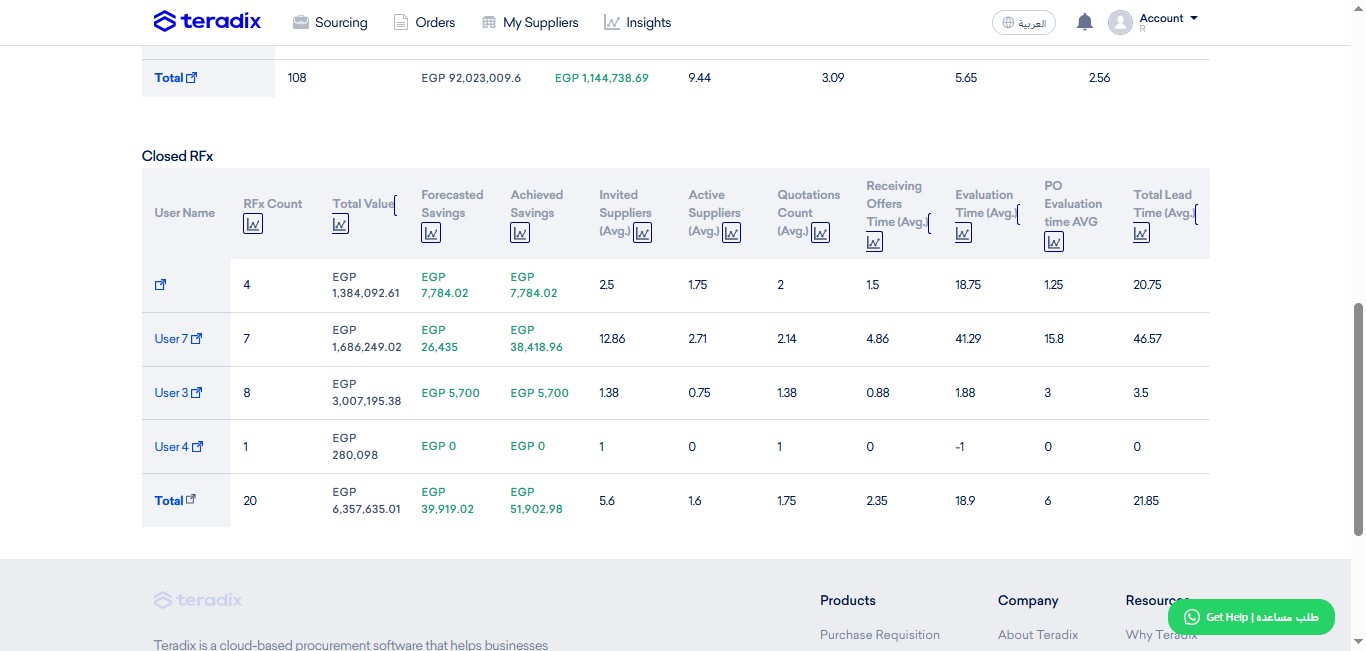
"Total Value"; which is the total managed spend across the sourcing events closed.
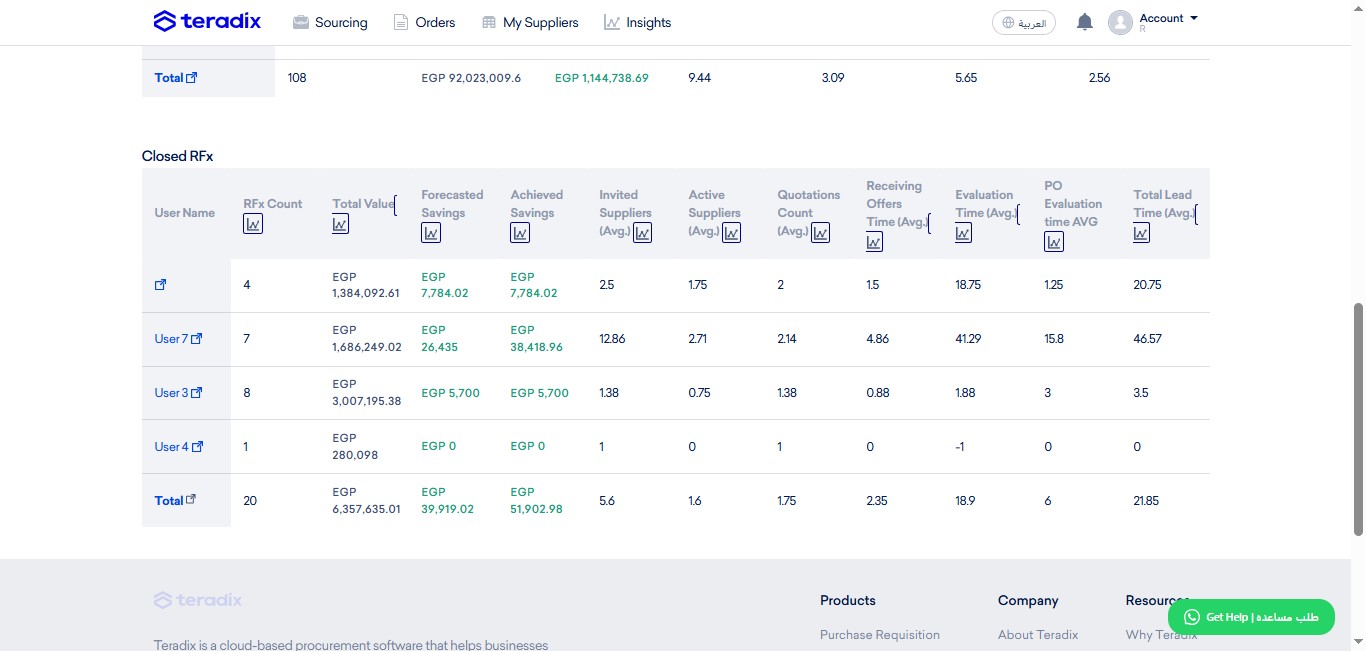
"Forecasted Savings"; which is the best price submitted minus lowest initial price submitted.
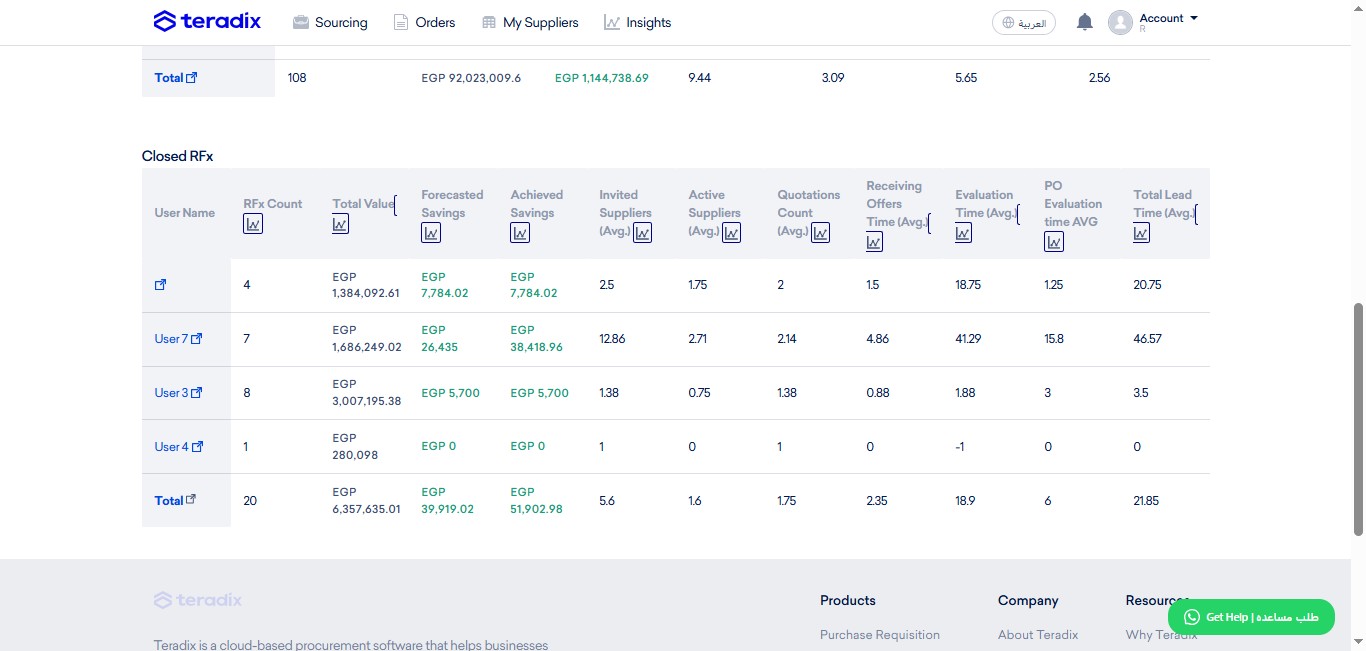
"Achieved Savings"; which indicates the savings which user acheived after closing.
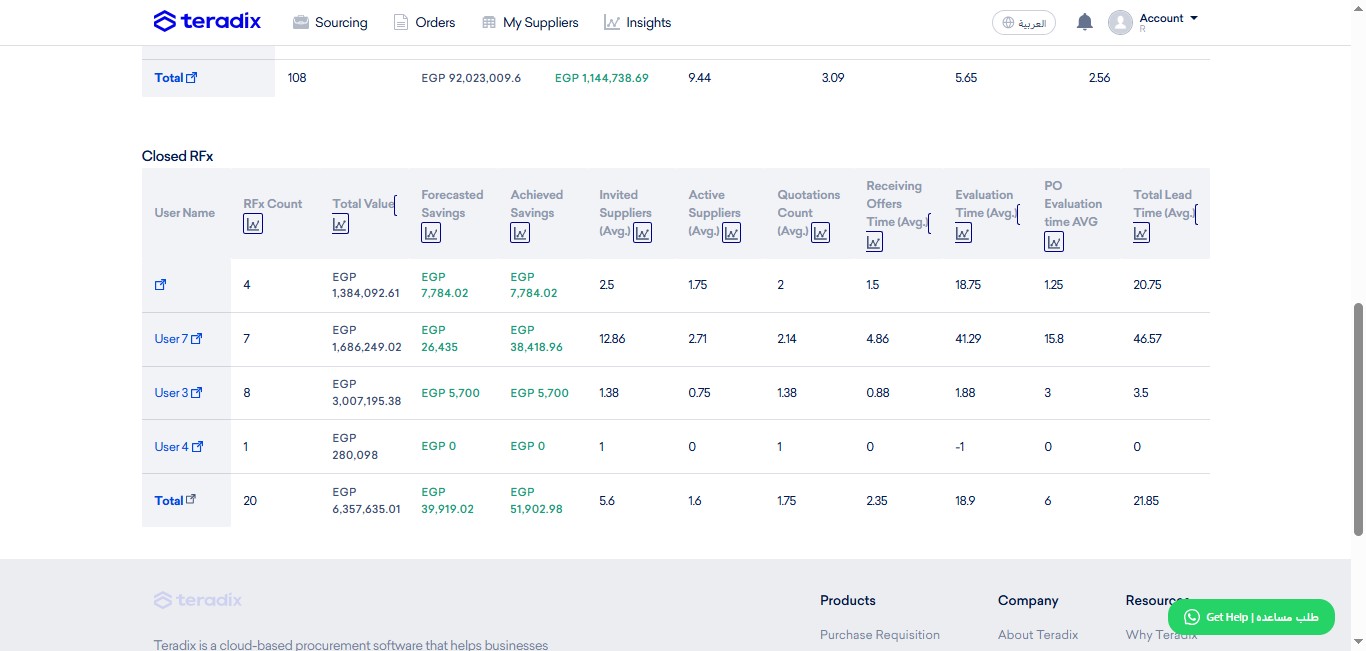
"Invited Suppliers (Avg.)"; which indicates the average number of suppliers, buyer invites in RFx.
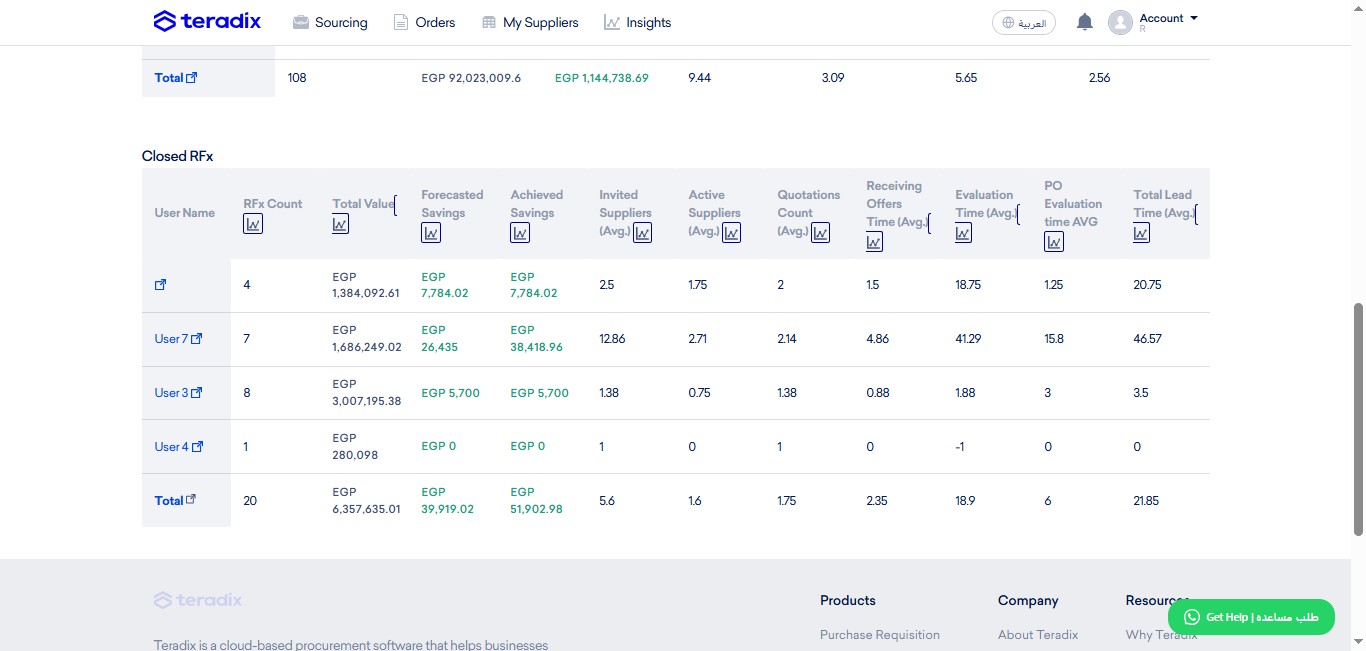
"Active Suppliers (Avg.)"; which indicates the acceptance rate of suppliers to the RFx they are invited on.
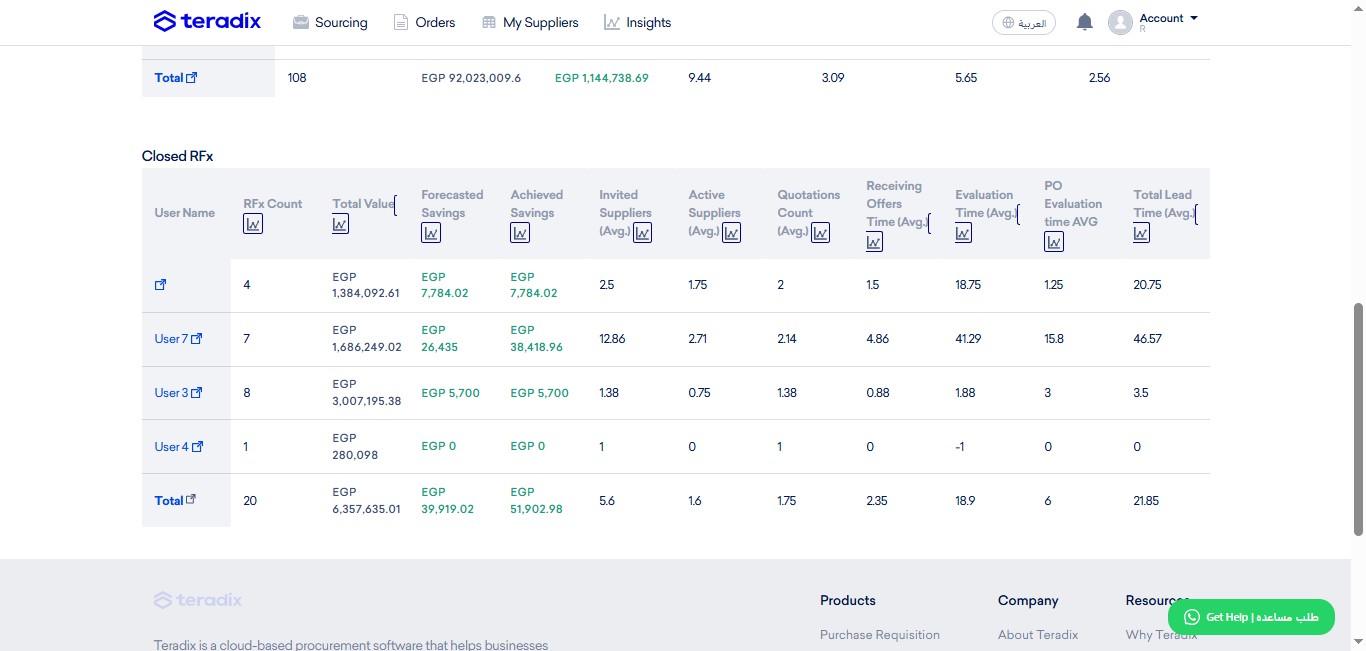
"Quotations Count (Avg.)"; which indicates the average number of quotations received from suppliers after they accept.
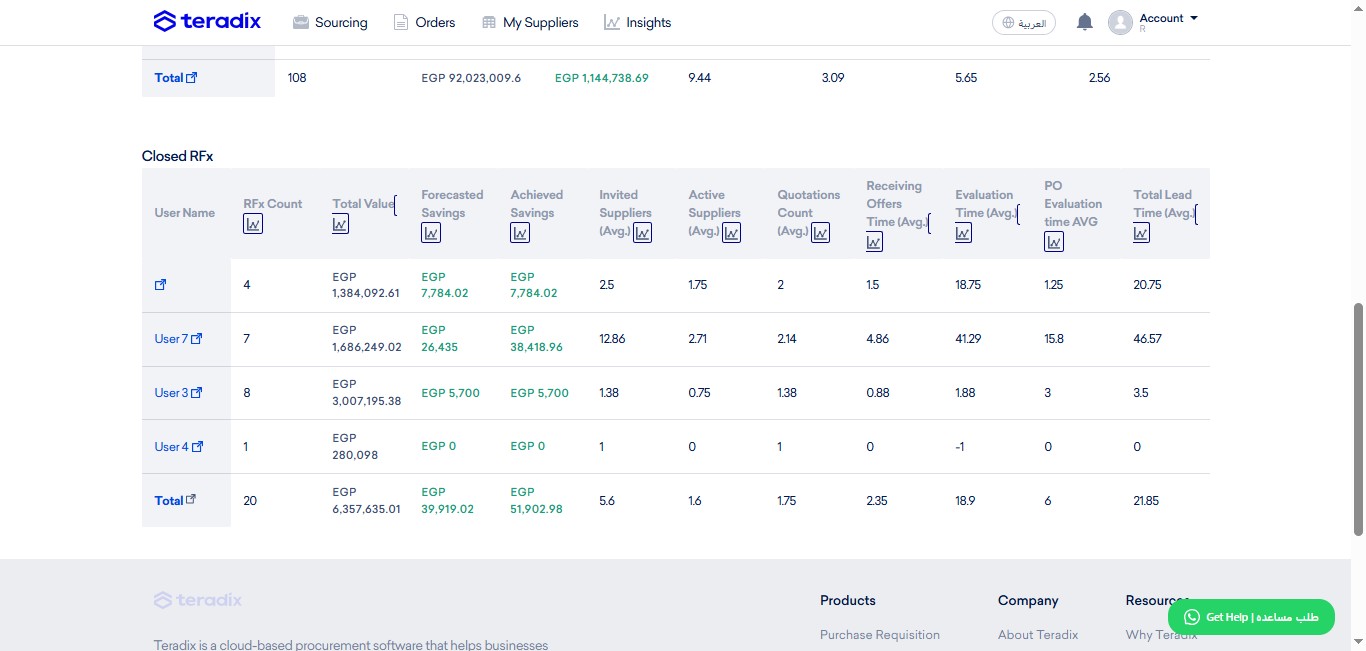
"Receiving Offers Time (Avg.)"; which indicates the average number of days through which buyer receives quotations from suppliers.
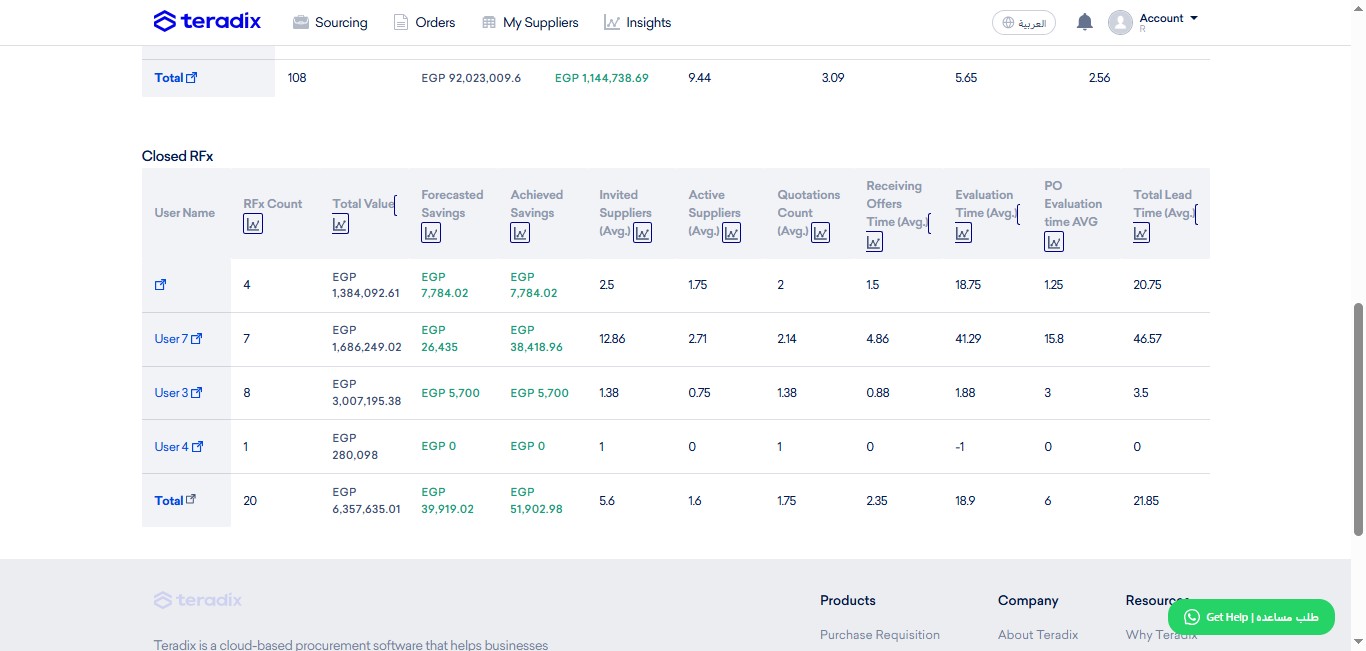
"Evaluation Time (Avg.)"; which indicates the number of days, technical evaluator(s) take, to finish evaluation.
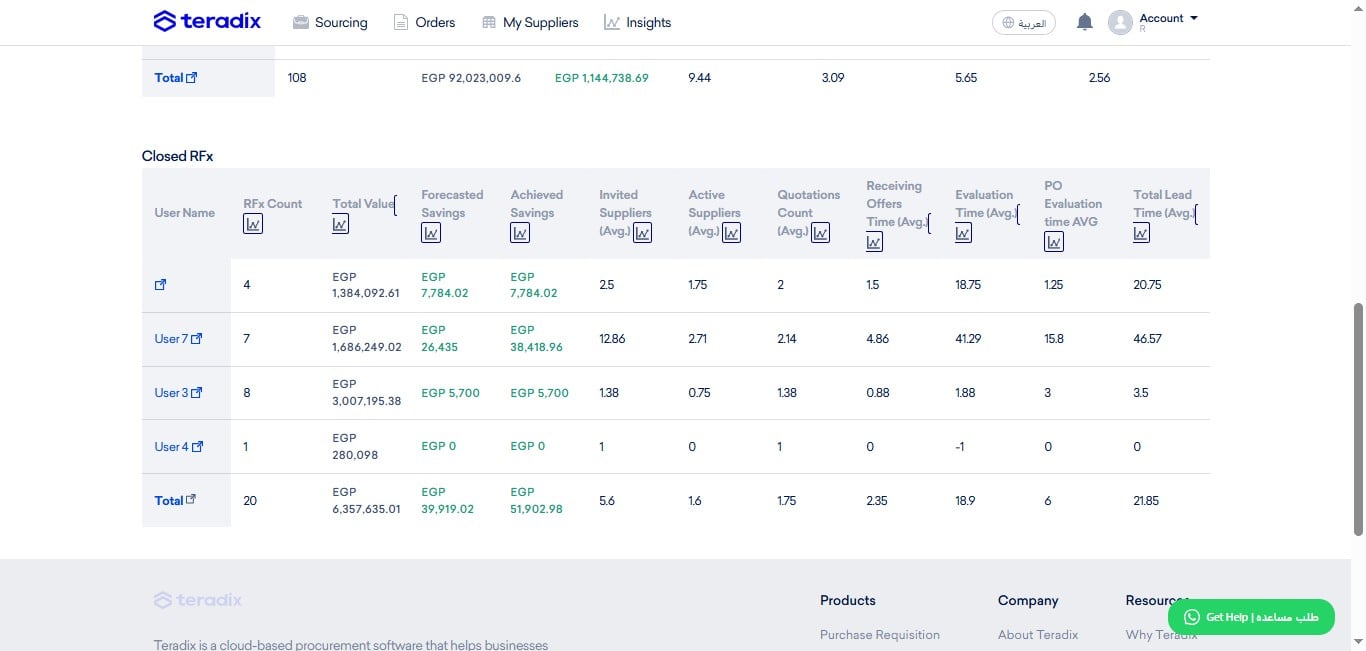
"PO Evaluation time (avg)"; which indicates the number of days taken for PO Approval cycle to finish decision making towards Purchase Orders.
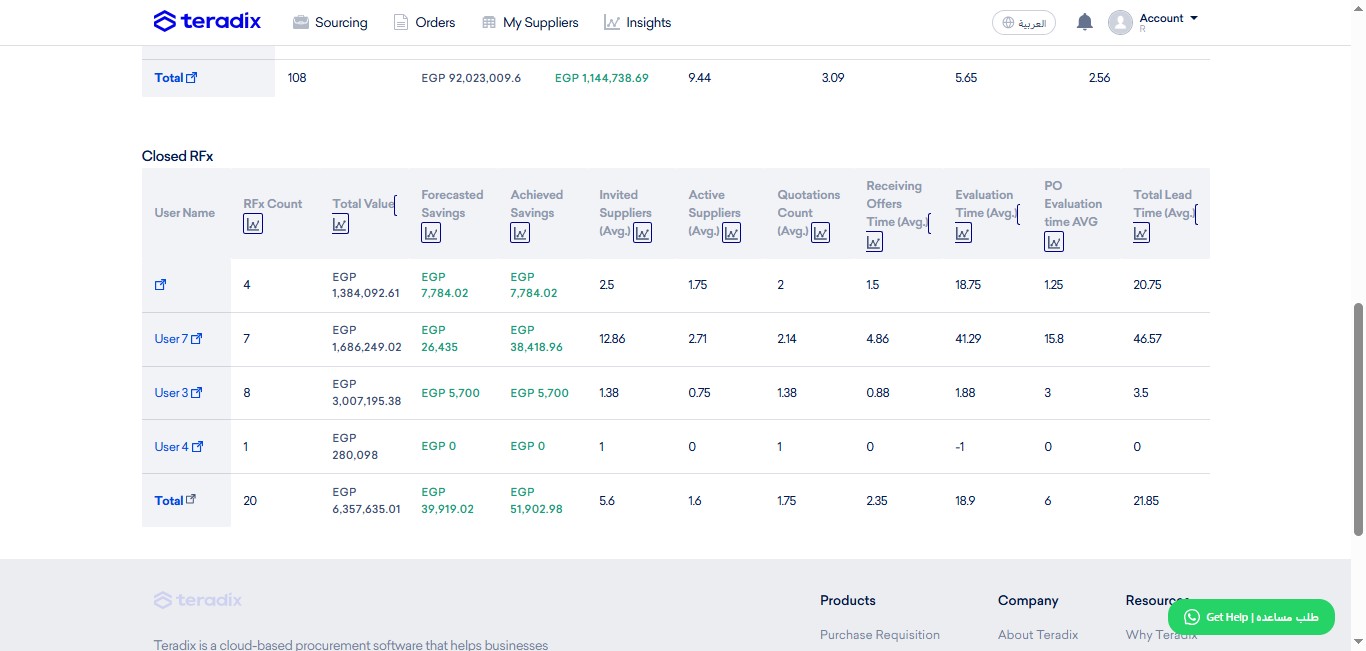
"Total Lead Time (Avg.)"; which indicates the PR to PO cycle time.
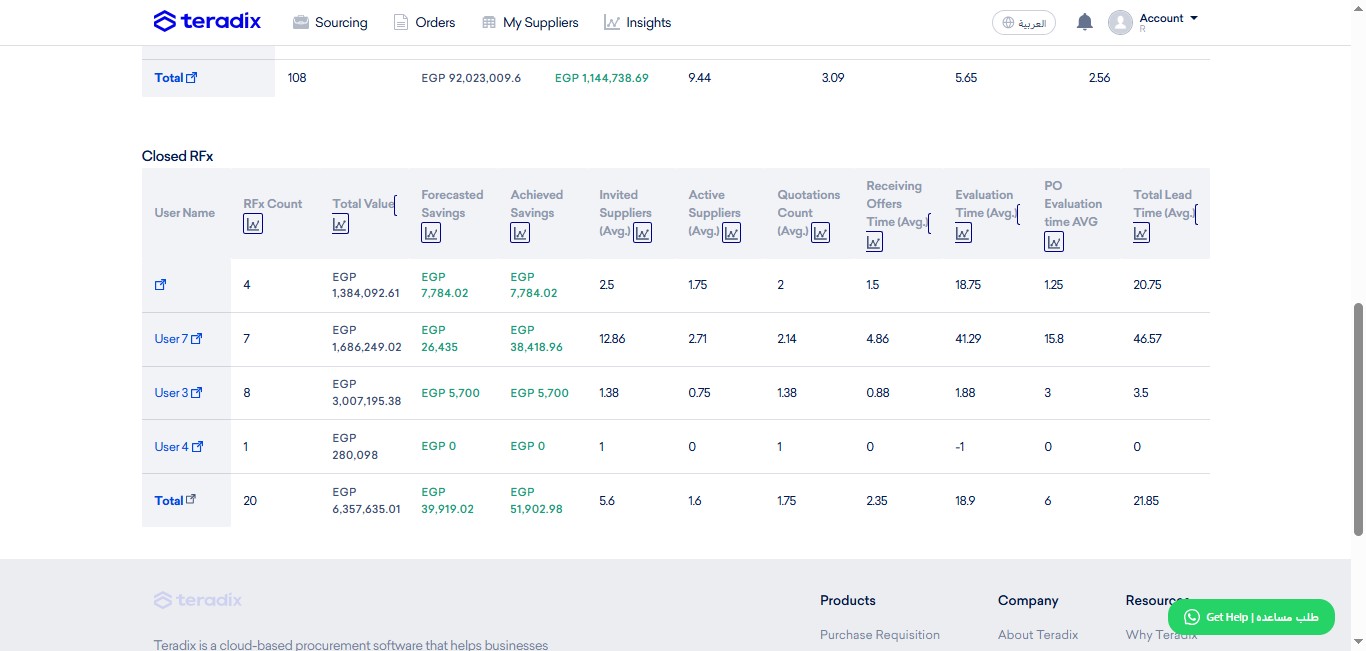
Click on the display name of each user to zoom-in, user-level, the assigned RFx accordingly.
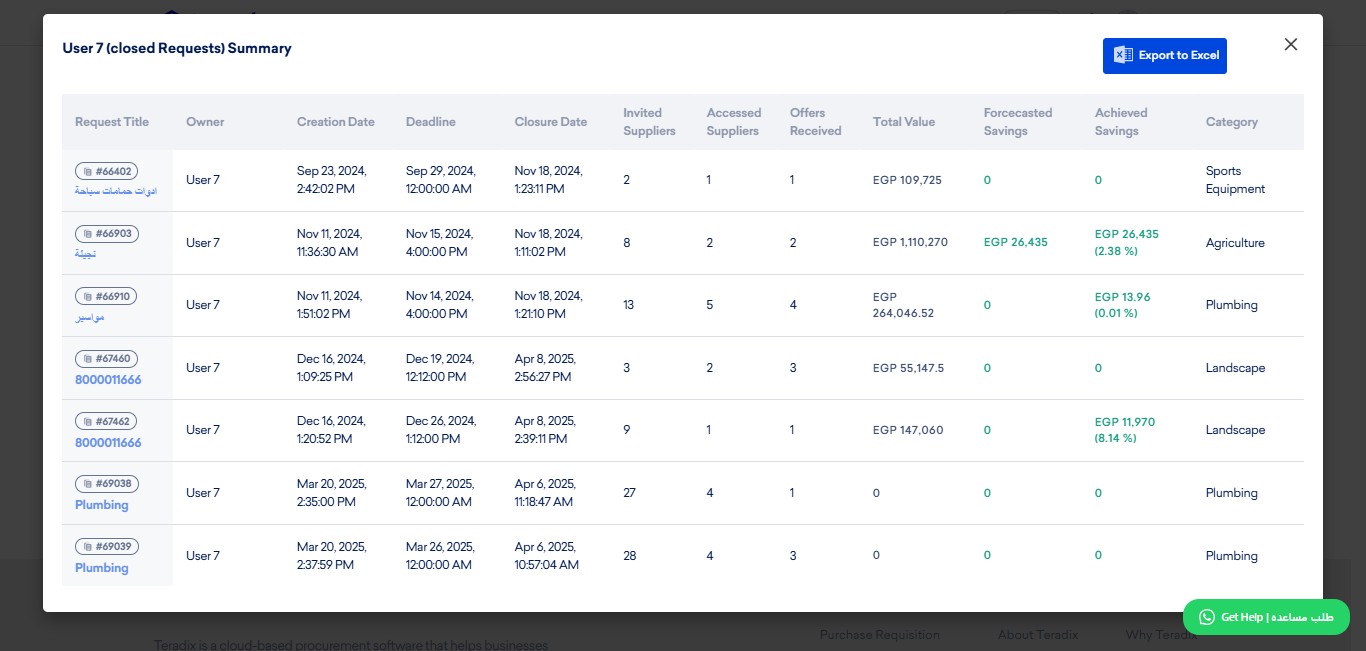
Find same Indicators, but user-level, except the following: when auditing user-level, you can check each RFx silo by click on it's title to delve in.
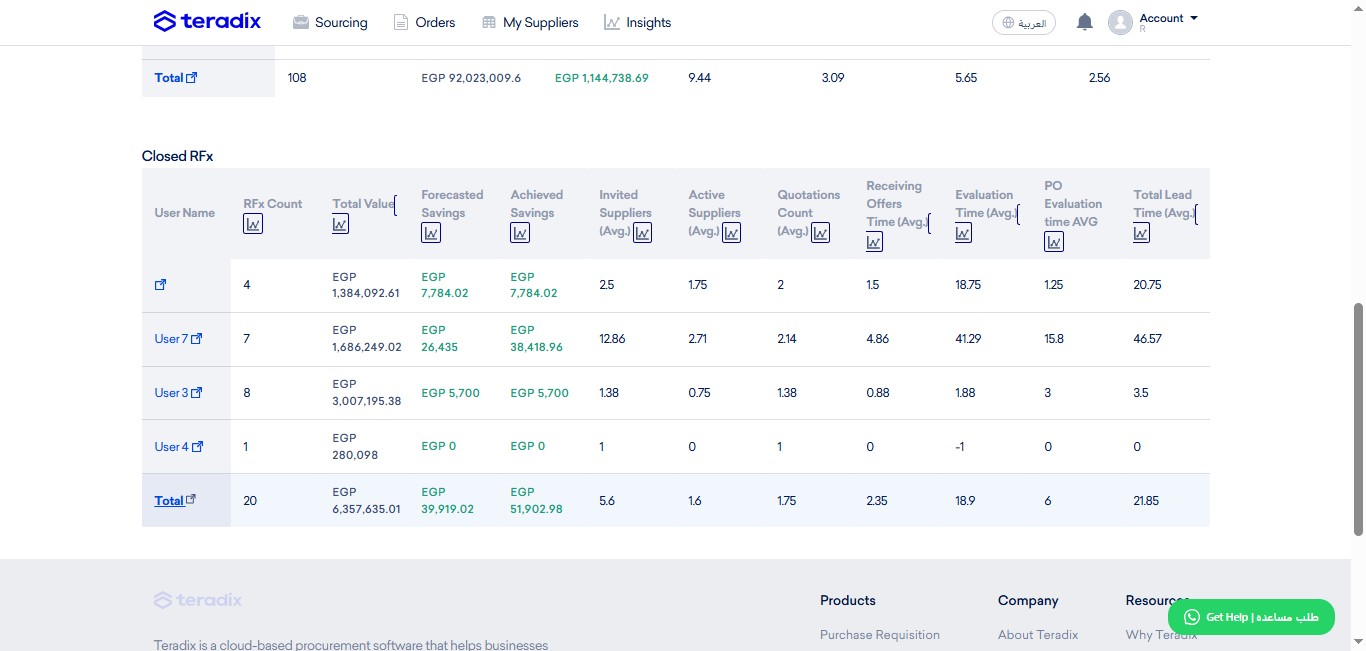
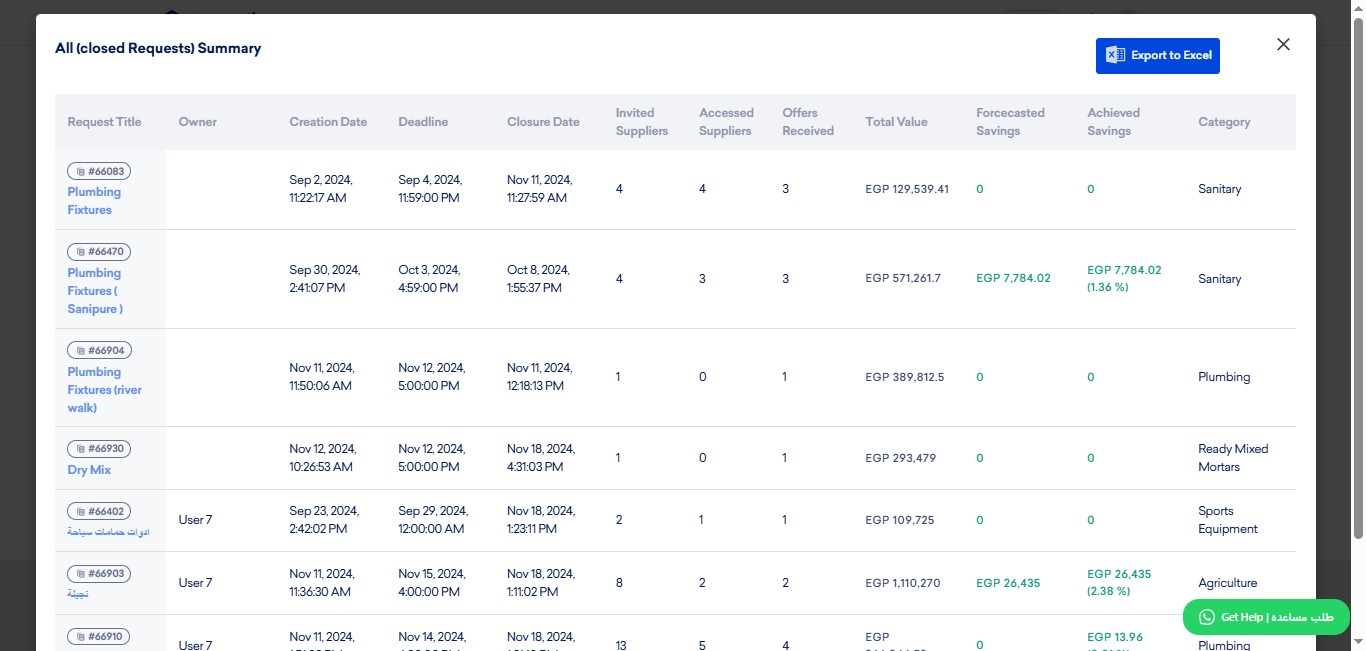
Click on "Total"; in order to audit all closed sourcing events across teammembers, limited by filters applied above.
Click on "Export to Excel"; in order to have a local excel sheet file of this data.
Click this graph icon to visualize indicators as follows;
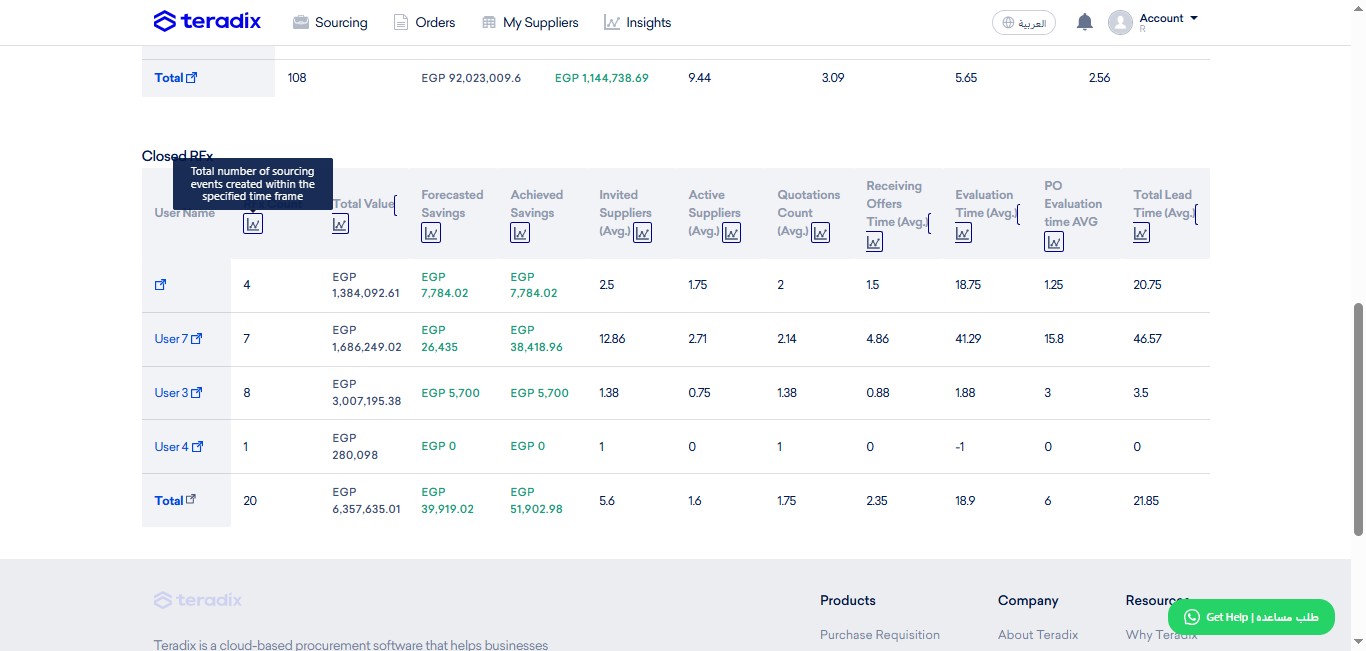
Click on users' names to hide, in order to certain users.
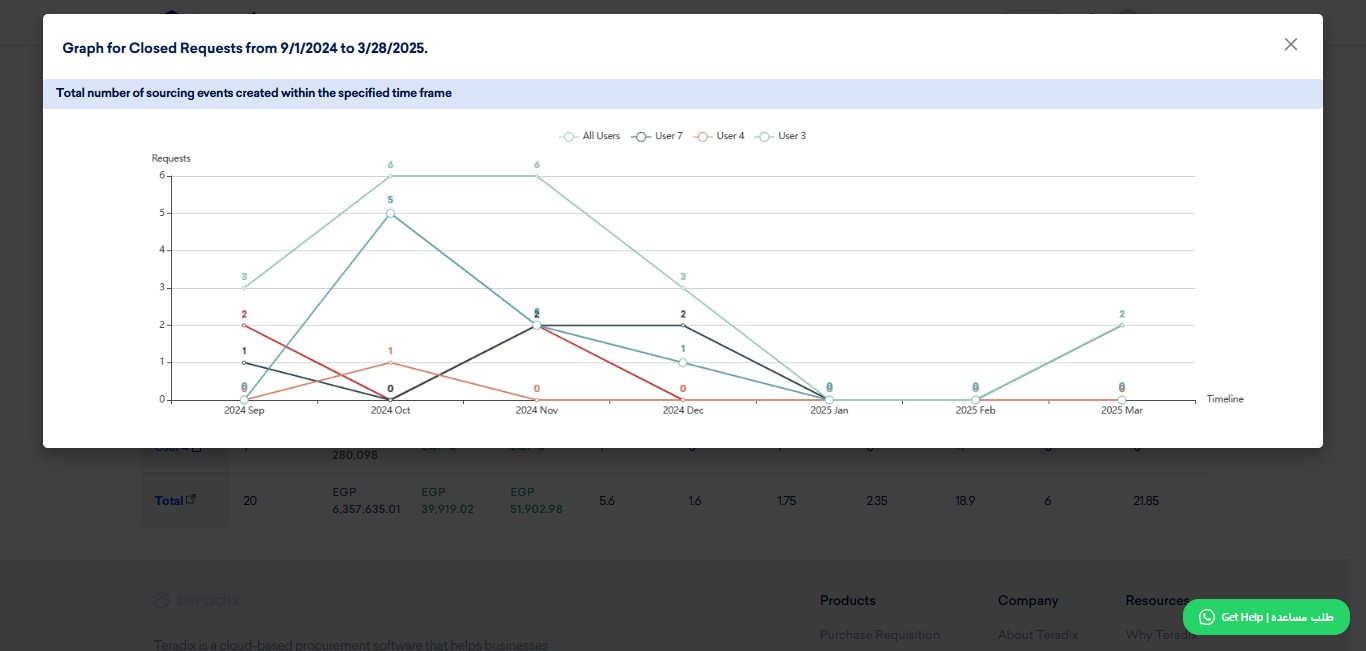
"User 3" is hidden now.
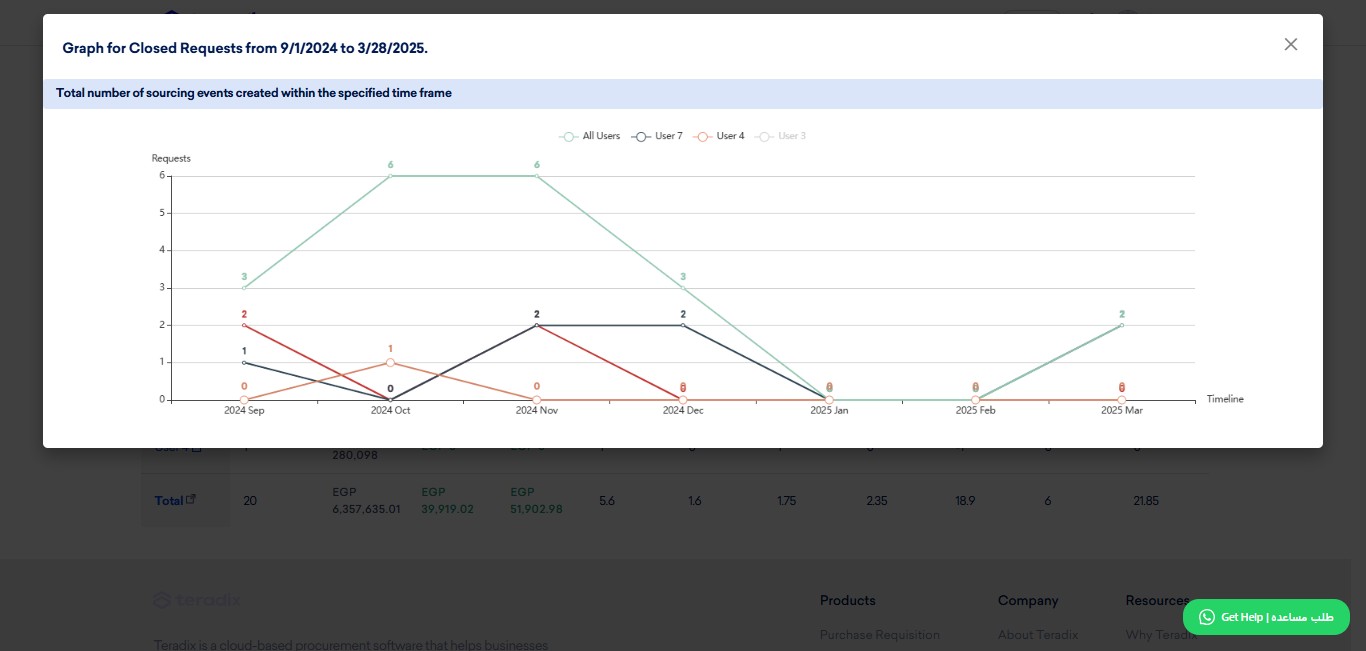
"User 4" is hidden now.
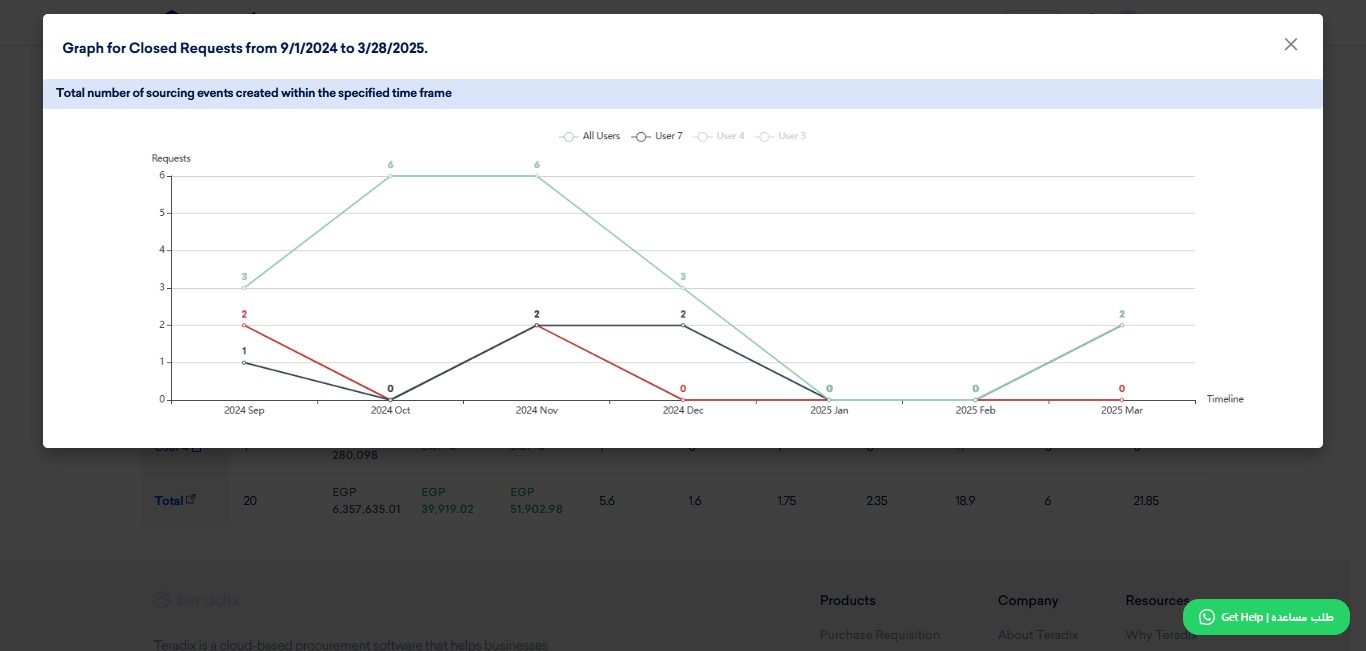
Done 🚀
Frequently Asked Questions
- What do the indicators in the Closed RFx section represent?
The Closed RFx indicators are: RFx Count — number of sourcing events closed per user (limited by the filters you applied above); Total Value — total managed spend across the closed sourcing events; Forecasted Savings — best price submitted minus lowest initial price submitted; Achieved Savings — savings the user achieved after closing; Invited Suppliers (Avg.) — average number of suppliers invited by the buyer to RFx; Active Suppliers (Avg.) — supplier acceptance rate to RFx they were invited on; Quotations Count (Avg.) — average number of quotations received after suppliers accept; Receiving Offers Time (Avg.) — average days for buyers to receive quotations from suppliers; Evaluation Time (Avg.) — days technical evaluator(s) take to finish evaluation; PO Evaluation Time (Avg.) — days taken for PO approval cycle to finish decision making toward Purchase Orders; Total Lead Time (Avg.) — PR to PO cycle time.
- How can I view data at a specific user level or drill into an RFx?
Click the display name of a user to zoom in to that user’s assigned RFx and see the same indicators at user level. When auditing user-level, click an RFx title (each RFx silo) to delve into its details.
- Why do the numbers change when I apply filters, and how do I audit across the whole team?
Values are limited by the filters you applied above, so changing filters will change RFx Count and other indicators. To audit all closed sourcing events across team members (still limited by the filters), click "Total."
- How do I export the Closed RFx data or see it as a graph?
Click "Export to Excel" to download a local Excel file of the displayed data. To visualize indicators, click the graph icon to show the indicators as a chart.
- How do I hide or show users in the visualization?
Click a user’s name in the graph to hide that user from the chart. (Example notes in the guide: "User 3 is hidden now." and "User 4 is hidden now.")